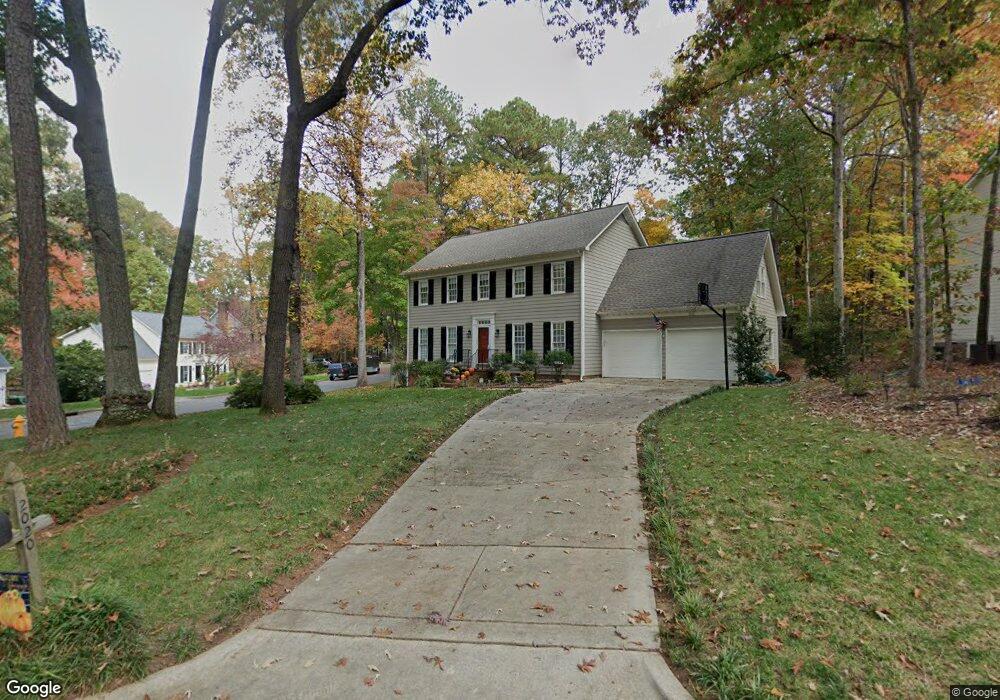
2020 Torrington St Raleigh, NC 27615
Stonehenge East NeighborhoodEstimated Value: $760,000 - $829,000
4
Beds
4
Baths
3,000
Sq Ft
$264/Sq Ft
Est. Value
About This Home
This home is located at 2020 Torrington St, Raleigh, NC 27615 and is currently estimated at $791,916, approximately $263 per square foot. 2020 Torrington St is a home located in Wake County with nearby schools including Lead Mine Elementary School, Carroll Middle, and Sanderson High School.
Ownership History
Date
Name
Owned For
Owner Type
Purchase Details
Closed on
May 10, 2019
Sold by
Pinkham Robert C and Pinkham Geneva
Bought by
Pinkham Robert C and Pinkham Geneva
Current Estimated Value
Purchase Details
Closed on
Oct 11, 2018
Sold by
Braga David J and Braga Deborah A
Bought by
Pinkham Robert and Pinkham Geneva
Purchase Details
Closed on
Dec 10, 2014
Sold by
Pinkham Robert C and Pinkham Geneva
Bought by
Pinkham Family Trust and Pinkham
Purchase Details
Closed on
Jul 1, 1987
Bought by
Braga David J and Braga Deborah A
Create a Home Valuation Report for This Property
The Home Valuation Report is an in-depth analysis detailing your home's value as well as a comparison with similar homes in the area
Home Values in the Area
Average Home Value in this Area
Purchase History
| Date | Buyer | Sale Price | Title Company |
|---|---|---|---|
| Pinkham Robert C | -- | None Available | |
| Pinkham Robert | $470,000 | None Available | |
| Pinkham Family Trust | -- | None Listed On Document | |
| Braga David J | $151,000 | -- |
Source: Public Records
Tax History Compared to Growth
Tax History
| Year | Tax Paid | Tax Assessment Tax Assessment Total Assessment is a certain percentage of the fair market value that is determined by local assessors to be the total taxable value of land and additions on the property. | Land | Improvement |
|---|---|---|---|---|
| 2025 | -- | $646,040 | $205,000 | $441,040 |
| 2024 | $5,631 | $646,040 | $205,000 | $441,040 |
| 2023 | $5,146 | $470,290 | $140,000 | $330,290 |
| 2022 | $4,782 | $470,290 | $140,000 | $330,290 |
| 2021 | $4,596 | $470,290 | $140,000 | $330,290 |
| 2020 | $4,512 | $470,290 | $140,000 | $330,290 |
| 2019 | $4,147 | $356,101 | $142,000 | $214,101 |
| 2018 | $3,911 | $356,101 | $142,000 | $214,101 |
| 2017 | $3,725 | $356,101 | $142,000 | $214,101 |
| 2016 | $3,648 | $356,101 | $142,000 | $214,101 |
| 2015 | $3,688 | $354,242 | $142,000 | $212,242 |
| 2014 | $3,498 | $354,242 | $142,000 | $212,242 |
Source: Public Records
Map
Nearby Homes
- 8809 Barleymoor Dr
- 8825 Leeshire Ln
- 3008 Eden Harbor Ct
- 2300 Valley Forge Dr
- 8700 Aldersgate Way
- 9021 Armitage Ct
- 7704 Falcon Rest Cir
- 7771 Falcon Rest Cir Unit 7771
- 8521 Harbor Dr
- 8337 Greywinds Dr
- 1516 Bridgeport Dr
- 1432 Quarter Point
- 9709 Baileywick Rd
- 8305 Greywinds Dr
- 1308 Hillbrow Ln Unit 203
- 8404 Sleepy Creek Dr
- 8713 Gleneagles Dr
- 717 Misty Isle Place
- 2204 Middlefield Ct
- 2704 Smokey Ridge Rd
- 2016 Torrington St
- 2404 Hamrick Dr
- 2405 Hamrick Dr
- 2409 Hamrick Dr
- 2012 Torrington St
- 2308 Hamrick Dr
- 2021 Torrington St
- 2408 Hamrick Dr
- 2401 Hamrick Dr
- 2008 Torrington St
- 2313 Hamrick Dr
- 2413 Hamrick Dr
- 2017 Torrington St
- 2412 Hamrick Dr
- 2417 Hamrick Dr
- 2013 Torrington St
- 8809 Gotherstone Ct
- 8805 Gotherstone Ct
- 2309 Hamrick Dr
- 2004 Tiverton Ct