2020 Valor Ct Unit 6 Glenview, IL 60026
The Glen NeighborhoodEstimated Value: $811,284 - $891,000
3
Beds
4
Baths
3,650
Sq Ft
$234/Sq Ft
Est. Value
About This Home
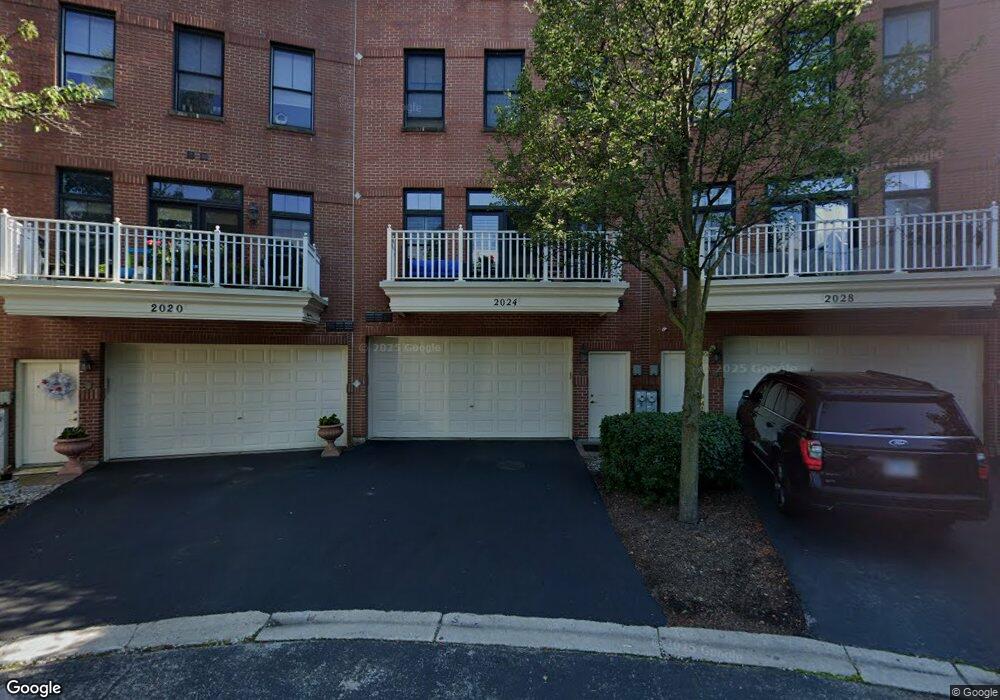
This home is located at 2020 Valor Ct Unit 6, Glenview, IL 60026 and is currently estimated at $852,571, approximately $233 per square foot. 2020 Valor Ct Unit 6 is a home located in Cook County with nearby schools including Westbrook Elementary School, Glen Grove Elementary School, and Attea Middle School.
Ownership History
Date
Name
Owned For
Owner Type
Purchase Details
Closed on
Sep 27, 2010
Sold by
Dunham Keith W and Dunham Kathleen L
Bought by
Egen Donna E
Current Estimated Value
Home Financials for this Owner
Home Financials are based on the most recent Mortgage that was taken out on this home.
Original Mortgage
$97,500
Outstanding Balance
$64,372
Interest Rate
4.36%
Mortgage Type
New Conventional
Estimated Equity
$788,199
Purchase Details
Closed on
Dec 6, 2006
Sold by
Minkus Sabra
Bought by
Dunham Keith W and Dunham Kathleen L
Home Financials for this Owner
Home Financials are based on the most recent Mortgage that was taken out on this home.
Original Mortgage
$660,000
Interest Rate
6.36%
Mortgage Type
Purchase Money Mortgage
Purchase Details
Closed on
Jun 30, 2004
Sold by
The Glen Townhomes Lp
Bought by
Minkus Sabra
Create a Home Valuation Report for This Property
The Home Valuation Report is an in-depth analysis detailing your home's value as well as a comparison with similar homes in the area
Home Values in the Area
Average Home Value in this Area
Purchase History
| Date | Buyer | Sale Price | Title Company |
|---|---|---|---|
| Egen Donna E | $687,500 | None Available | |
| Dunham Keith W | $850,000 | Republic Title Company | |
| Minkus Sabra | $908,000 | Stewart Title Company |
Source: Public Records
Mortgage History
| Date | Status | Borrower | Loan Amount |
|---|---|---|---|
| Open | Egen Donna E | $97,500 | |
| Previous Owner | Dunham Keith W | $660,000 |
Source: Public Records
Tax History Compared to Growth
Tax History
| Year | Tax Paid | Tax Assessment Tax Assessment Total Assessment is a certain percentage of the fair market value that is determined by local assessors to be the total taxable value of land and additions on the property. | Land | Improvement |
|---|---|---|---|---|
| 2024 | $15,880 | $75,063 | $8,639 | $66,424 |
| 2023 | $15,410 | $75,063 | $8,639 | $66,424 |
| 2022 | $15,410 | $75,063 | $8,639 | $66,424 |
| 2021 | $16,259 | $68,656 | $4,146 | $64,510 |
| 2020 | $16,123 | $68,656 | $4,146 | $64,510 |
| 2019 | $15,024 | $75,459 | $4,146 | $71,313 |
| 2018 | $14,442 | $66,230 | $3,628 | $62,602 |
| 2017 | $14,071 | $66,230 | $3,628 | $62,602 |
| 2016 | $13,481 | $66,230 | $3,628 | $62,602 |
| 2015 | $13,207 | $58,084 | $2,937 | $55,147 |
| 2014 | $12,978 | $58,084 | $2,937 | $55,147 |
| 2013 | $13,578 | $59,906 | $2,937 | $56,969 |
Source: Public Records
Map
Nearby Homes
- 2005 Valor Ct Unit 43
- 1867 Admiral Ct Unit 91
- 1891 Admiral Ct Unit 79
- 2701 Commons Dr Unit 210
- 1735 Patriot Blvd
- 3081 Saratoga Ln
- 1615 Greenwood Rd
- 187 Princeton Ln Unit 35RG18
- 102 Yale Ct Unit 34LH10
- 2750 Langley Cir Unit 203013
- 3537 Maple Leaf Dr
- 1704 Executive Ln
- 2000 Chestnut Ave Unit 103
- 2156 Rugen Rd Unit A
- 3212 Lindenwood Ln
- 2545 Salceda Dr Unit 5B2545S
- 2571 Essex Dr
- 2050 Valencia Dr Unit 300C
- 2050 Valencia Dr Unit 405C
- 2526 Essex Dr
- 2016 Valor Ct Unit 5
- 2016 Valor Ct Unit 1
- 2024 Valor Ct Unit 7
- 2012 Valor Ct Unit 4
- 2032 Valor Ct Unit 2032
- 2008 Valor Ct Unit 3
- 2036 Valor Ct Unit 10
- 2040 Valor Ct Unit 11
- 2756 Valor Dr Unit 53
- 2760 Valor Dr Unit 54
- 2764 Valor Dr Unit 55
- 2752 Valor Dr Unit 52
- 2044 Valor Ct Unit 12
- 2000 Valor Ct Unit 1
- 2048 Valor Ct Unit 13
- 2052 Valor Ct Unit 14
- 2004 Valor Ct Unit 2
- 2744 Valor Dr Unit 50
- 2060 Valor Ct Unit 16