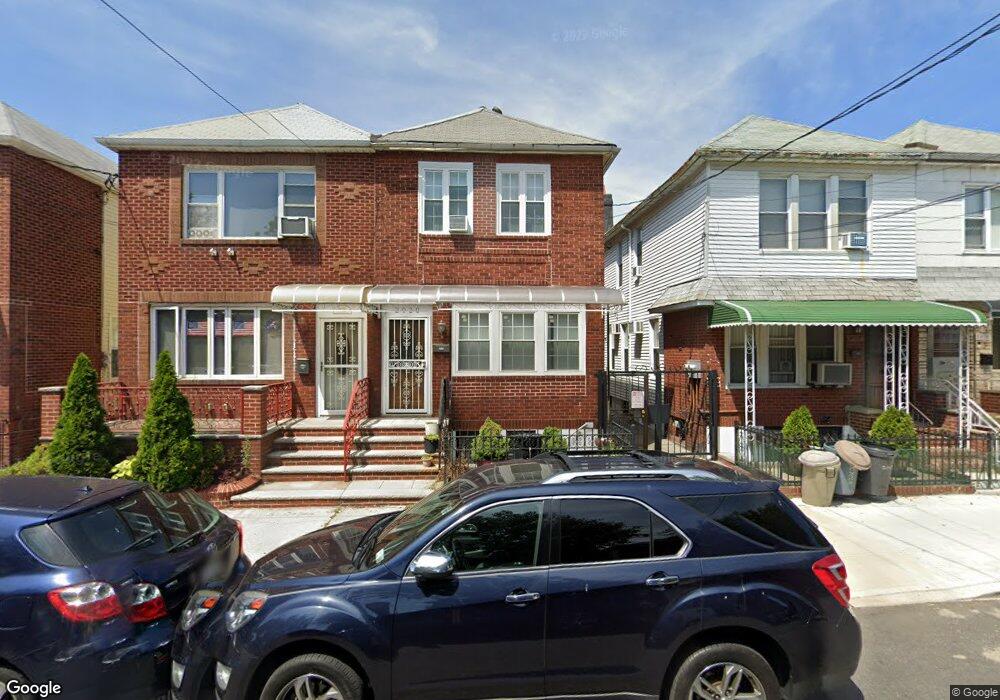
2020 W 4th St Brooklyn, NY 11223
Gravesend NeighborhoodEstimated Value: $1,024,787 - $1,132,000
--
Bed
--
Bath
1,440
Sq Ft
$735/Sq Ft
Est. Value
About This Home
This home is located at 2020 W 4th St, Brooklyn, NY 11223 and is currently estimated at $1,057,947, approximately $734 per square foot. 2020 W 4th St is a home located in Kings County with nearby schools including P.S. 95 - The Gravesend, Is 228 David A Boody, and Coney Island Preparatory Public Charter School.
Ownership History
Date
Name
Owned For
Owner Type
Purchase Details
Closed on
Sep 9, 2016
Sold by
Tran Andrew
Bought by
Gao Teresa Pindan and Li Yuping
Current Estimated Value
Home Financials for this Owner
Home Financials are based on the most recent Mortgage that was taken out on this home.
Original Mortgage
$533,850
Outstanding Balance
$426,693
Interest Rate
3.45%
Mortgage Type
Purchase Money Mortgage
Estimated Equity
$631,254
Purchase Details
Closed on
Mar 11, 1997
Sold by
Ngo Anthony Tuu
Bought by
Tran Andrew and Tran Hue Ly
Create a Home Valuation Report for This Property
The Home Valuation Report is an in-depth analysis detailing your home's value as well as a comparison with similar homes in the area
Home Values in the Area
Average Home Value in this Area
Purchase History
| Date | Buyer | Sale Price | Title Company |
|---|---|---|---|
| Gao Teresa Pindan | $718,000 | -- | |
| Tran Andrew | $85,000 | First American Title Ins Co |
Source: Public Records
Mortgage History
| Date | Status | Borrower | Loan Amount |
|---|---|---|---|
| Open | Gao Teresa Pindan | $533,850 |
Source: Public Records
Tax History Compared to Growth
Tax History
| Year | Tax Paid | Tax Assessment Tax Assessment Total Assessment is a certain percentage of the fair market value that is determined by local assessors to be the total taxable value of land and additions on the property. | Land | Improvement |
|---|---|---|---|---|
| 2025 | $7,037 | $58,080 | $10,800 | $47,280 |
| 2024 | $7,037 | $65,040 | $10,800 | $54,240 |
| 2023 | $7,115 | $70,740 | $10,800 | $59,940 |
| 2022 | $6,694 | $61,800 | $10,800 | $51,000 |
| 2021 | $6,695 | $47,700 | $10,800 | $36,900 |
| 2020 | $5,021 | $57,060 | $10,800 | $46,260 |
| 2019 | $6,108 | $52,680 | $10,800 | $41,880 |
| 2018 | $5,697 | $29,196 | $6,183 | $23,013 |
| 2017 | $5,697 | $27,945 | $6,601 | $21,344 |
Source: Public Records
Map
Nearby Homes