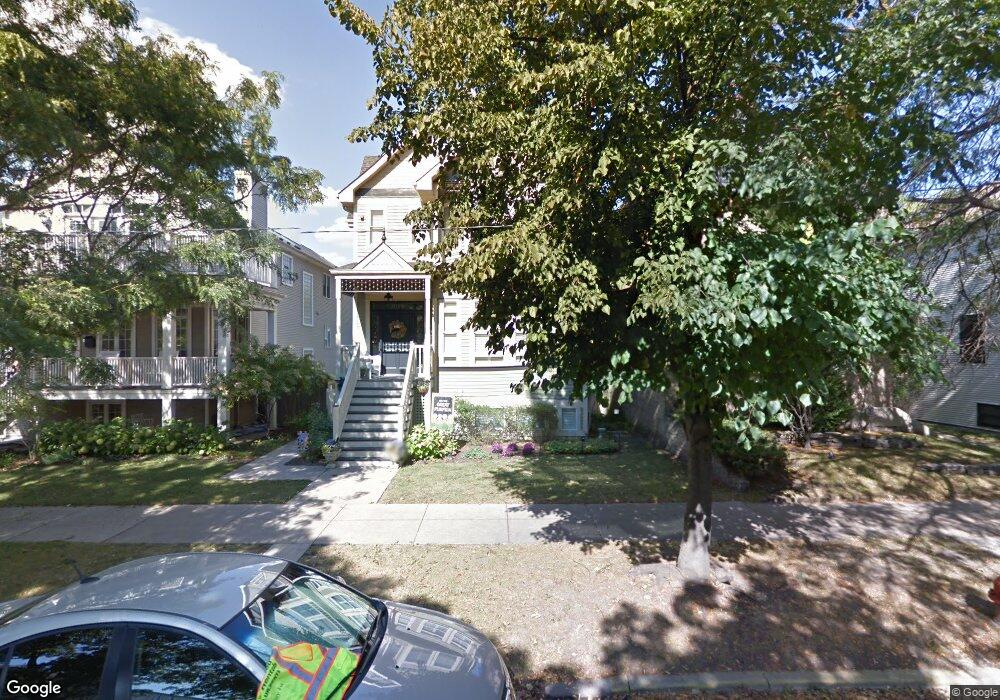
2020 W Giddings St Chicago, IL 60625
Ravenswood NeighborhoodEstimated Value: $1,568,000 - $2,257,000
6
Beds
5
Baths
4,500
Sq Ft
$420/Sq Ft
Est. Value
About This Home
This home is located at 2020 W Giddings St, Chicago, IL 60625 and is currently estimated at $1,889,030, approximately $419 per square foot. 2020 W Giddings St is a home located in Cook County with nearby schools including McPherson Elementary School, Amundsen High School, and Lycee Francais de Chicago.
Ownership History
Date
Name
Owned For
Owner Type
Purchase Details
Closed on
Jan 23, 2014
Sold by
Huber Mark J and Huber Sarah E
Bought by
Huber Sarah E and Sarah E Huber Revocable Trust
Current Estimated Value
Purchase Details
Closed on
Jun 24, 2005
Sold by
Schneider Valentine J and Schneider Kathleen
Bought by
Huber Mark J and Huber Sarah E
Home Financials for this Owner
Home Financials are based on the most recent Mortgage that was taken out on this home.
Original Mortgage
$465,000
Outstanding Balance
$241,507
Interest Rate
5.68%
Mortgage Type
Fannie Mae Freddie Mac
Estimated Equity
$1,647,523
Purchase Details
Closed on
Nov 1, 2004
Sold by
Schneider Valentine J
Bought by
Schneider Valentine J and Schneider Kathleen
Purchase Details
Closed on
Apr 16, 2001
Sold by
Schneider Nancy Bell
Bought by
Schneider Nancy Bell and Schneider Valentine J
Home Financials for this Owner
Home Financials are based on the most recent Mortgage that was taken out on this home.
Original Mortgage
$163,600
Interest Rate
6.99%
Create a Home Valuation Report for This Property
The Home Valuation Report is an in-depth analysis detailing your home's value as well as a comparison with similar homes in the area
Home Values in the Area
Average Home Value in this Area
Purchase History
| Date | Buyer | Sale Price | Title Company |
|---|---|---|---|
| Huber Sarah E | -- | None Available | |
| Huber Mark J | $620,000 | Multiple | |
| Schneider Valentine J | -- | -- | |
| Schneider Nancy Bell | -- | -- |
Source: Public Records
Mortgage History
| Date | Status | Borrower | Loan Amount |
|---|---|---|---|
| Open | Huber Mark J | $465,000 | |
| Previous Owner | Schneider Nancy Bell | $163,600 |
Source: Public Records
Tax History Compared to Growth
Tax History
| Year | Tax Paid | Tax Assessment Tax Assessment Total Assessment is a certain percentage of the fair market value that is determined by local assessors to be the total taxable value of land and additions on the property. | Land | Improvement |
|---|---|---|---|---|
| 2024 | $27,475 | $177,000 | $50,387 | $126,613 |
| 2023 | $27,321 | $133,534 | $40,671 | $92,863 |
| 2022 | $27,321 | $136,251 | $40,671 | $95,580 |
| 2021 | $26,729 | $136,251 | $40,671 | $95,580 |
| 2020 | $24,909 | $114,916 | $21,691 | $93,225 |
| 2019 | $24,683 | $126,282 | $21,691 | $104,591 |
| 2018 | $24,266 | $126,282 | $21,691 | $104,591 |
| 2017 | $19,616 | $94,500 | $18,979 | $75,521 |
| 2016 | $18,427 | $94,500 | $18,979 | $75,521 |
| 2015 | $16,836 | $94,500 | $18,979 | $75,521 |
| 2014 | $15,851 | $88,000 | $14,460 | $73,540 |
| 2013 | $15,527 | $88,000 | $14,460 | $73,540 |
Source: Public Records
Map
Nearby Homes
- 4814 N Damen Ave Unit 209
- 4726 N Winchester Ave Unit C
- 4726 N Winchester Ave Unit F
- 4906 N Winchester Ave
- 2224 W Eastwood Ave
- 4948 N Winchester Ave
- 4909 N Wolcott Ave Unit 2B
- 1949 W Argyle St Unit 19491
- 2034 W Sunnyside Ave
- 2163 W Windsor Ave
- 4545 N Wolcott Ave Unit 1
- 4929 N Wolcott Ave Unit 1A
- 4745 N Ravenswood Ave Unit 210
- 5015 N Damen Ave
- 2248 W Ainslie St
- 4947 N Wolcott Ave Unit 1B
- 5401-5447 N Wolcott Ave
- 4938 N Bell Ave
- 5013 N Wolcott Ave Unit 3W
- 4846 N Hermitage Ave
- 2022 W Giddings St
- 2016 W Giddings St
- 2016 W Giddings St
- 2012 W Giddings St
- 2026 W Giddings St
- 2030 W Giddings St
- 2008 W Giddings St
- 2006 W Giddings St Unit 3
- 2006 W Giddings St
- 2034 W Giddings St
- 2034 W Giddings St
- 4740 N Damen Ave
- 4742 N Damen Ave
- 4736 N Damen Ave
- 4736 N Damen Ave Unit 2
- 4736 N Damen Ave
- 4734 N Damen Ave Unit 3
- 4734 N Damen Ave Unit 2
- 2023 W Giddings St
- 2015 W Giddings St Unit 1