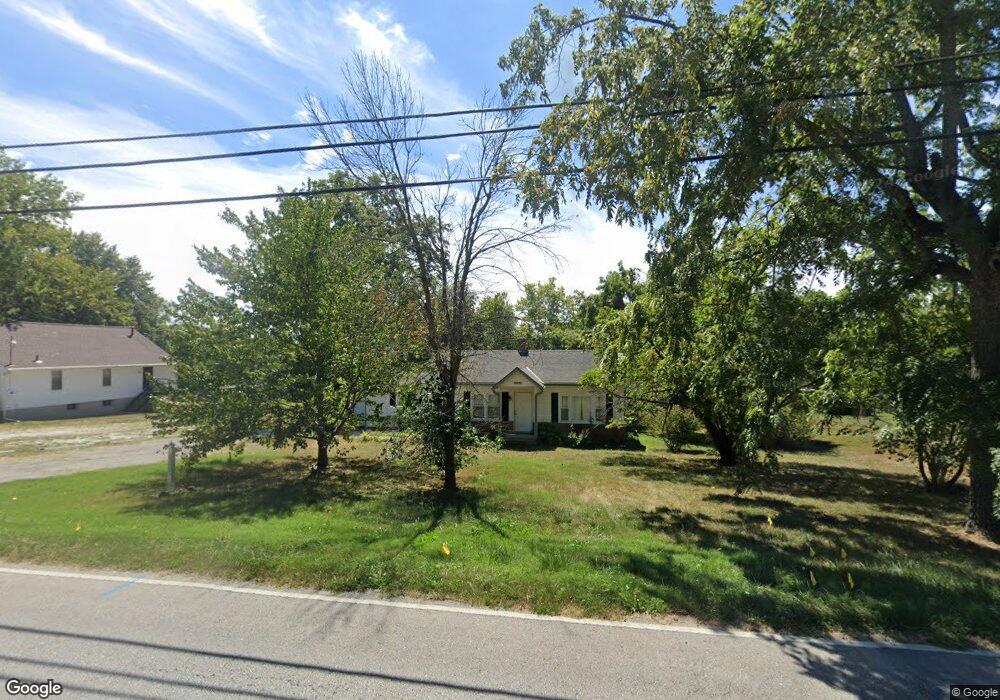
20201 E Truman Rd Independence, MO 64056
Bridger NeighborhoodEstimated Value: $147,000 - $249,000
3
Beds
1
Bath
918
Sq Ft
$206/Sq Ft
Est. Value
About This Home
This home is located at 20201 E Truman Rd, Independence, MO 64056 and is currently estimated at $188,790, approximately $205 per square foot. 20201 E Truman Rd is a home located in Jackson County with nearby schools including Spring Branch Elementary School, Bridger Middle School, and Bingham Middle School.
Ownership History
Date
Name
Owned For
Owner Type
Purchase Details
Closed on
Nov 17, 2025
Sold by
Antle Vincent and Antle Julie
Bought by
Easy Home Today Llc 8 Series
Current Estimated Value
Purchase Details
Closed on
Feb 14, 2019
Sold by
Pride Properties Llc
Bought by
Antle Vincent
Home Financials for this Owner
Home Financials are based on the most recent Mortgage that was taken out on this home.
Original Mortgage
$66,750
Interest Rate
4.4%
Mortgage Type
New Conventional
Purchase Details
Closed on
Jul 27, 2018
Sold by
Estes Betty Jo
Bought by
Pride Properties Llc and A Kansas Llc
Home Financials for this Owner
Home Financials are based on the most recent Mortgage that was taken out on this home.
Original Mortgage
$64,365
Interest Rate
4.5%
Mortgage Type
Future Advance Clause Open End Mortgage
Purchase Details
Closed on
Dec 9, 1999
Sold by
Parker Donald L and Parker Lisa J
Bought by
Cartmill Terry L
Home Financials for this Owner
Home Financials are based on the most recent Mortgage that was taken out on this home.
Original Mortgage
$59,073
Interest Rate
7.86%
Mortgage Type
Purchase Money Mortgage
Create a Home Valuation Report for This Property
The Home Valuation Report is an in-depth analysis detailing your home's value as well as a comparison with similar homes in the area
Home Values in the Area
Average Home Value in this Area
Purchase History
| Date | Buyer | Sale Price | Title Company |
|---|---|---|---|
| Easy Home Today Llc 8 Series | $143,000 | Alpha Title | |
| Antle Vincent | -- | Alpha Title Guaranty Inc | |
| Pride Properties Llc | -- | Alpha Title Guaranty Inc | |
| Cartmill Terry L | -- | Chicago Title Co |
Source: Public Records
Mortgage History
| Date | Status | Borrower | Loan Amount |
|---|---|---|---|
| Previous Owner | Antle Vincent | $66,750 | |
| Previous Owner | Pride Properties Llc | $64,365 | |
| Previous Owner | Cartmill Terry L | $59,073 |
Source: Public Records
Tax History
| Year | Tax Paid | Tax Assessment Tax Assessment Total Assessment is a certain percentage of the fair market value that is determined by local assessors to be the total taxable value of land and additions on the property. | Land | Improvement |
|---|---|---|---|---|
| 2025 | $1,693 | $23,118 | $4,678 | $18,440 |
| 2024 | $1,693 | $24,434 | $3,730 | $20,704 |
| 2023 | $1,654 | $24,434 | $4,020 | $20,414 |
| 2022 | $1,291 | $17,480 | $3,121 | $14,359 |
| 2021 | $1,291 | $17,480 | $3,121 | $14,359 |
| 2020 | $1,159 | $15,245 | $3,121 | $12,124 |
| 2019 | $1,140 | $15,245 | $3,121 | $12,124 |
| 2018 | $1,039 | $13,268 | $2,716 | $10,552 |
| 2017 | $1,023 | $13,268 | $2,716 | $10,552 |
| 2016 | $1,023 | $12,936 | $2,544 | $10,392 |
| 2014 | $972 | $12,559 | $2,470 | $10,089 |
Source: Public Records
Map
Nearby Homes
- 20108 E 12th Terrace S
- 20118 E Truman Rd
- 20021 E 13th St S
- 801 S Butler Ln
- 907 S Jones Rd
- 20602 E Truman Rd N
- 20802 E 13th Terrace S
- 655 S Ranson St
- 933 S Kisner Dr
- 701 S Jones Rd
- 1206 Ranson Place
- 1804 S Sioux Ct
- 728 S Kisner Dr
- 21111 E 8th St S
- 1904 S Davis Ave
- 20204 E 23rd Ter Ct S
- 18710 E Truman Rd
- 2309 S Heartland Ct
- 18801 E 24th Terrace S
- 2431 S Ponca Ave
- 20119 E Truman Rd
- 20112 E 12th Terrace S
- 20116 E 12th Terrace S
- 20115 E Truman Rd
- 20213 E Truman Rd
- 20120 E 12th Terrace S
- 20104 E 12th Terrace S
- 20200 E 12th Terrace S
- 20210 E Truman Rd
- 20100 E 12th Terrace S
- 20200 E Truman Rd
- 20105 E Truman Rd
- 20204 E 12th Terrace S
- 20024 E 12th Terrace S
- 1226 Clark Ave
- 20109 E 12th Terrace S
- 20020 E 12th Terrace S
- 20105 E 12th Terrace S
- 1230 Clark Ave
- 20015 E Truman Rd
Your Personal Tour Guide
Ask me questions while you tour the home.