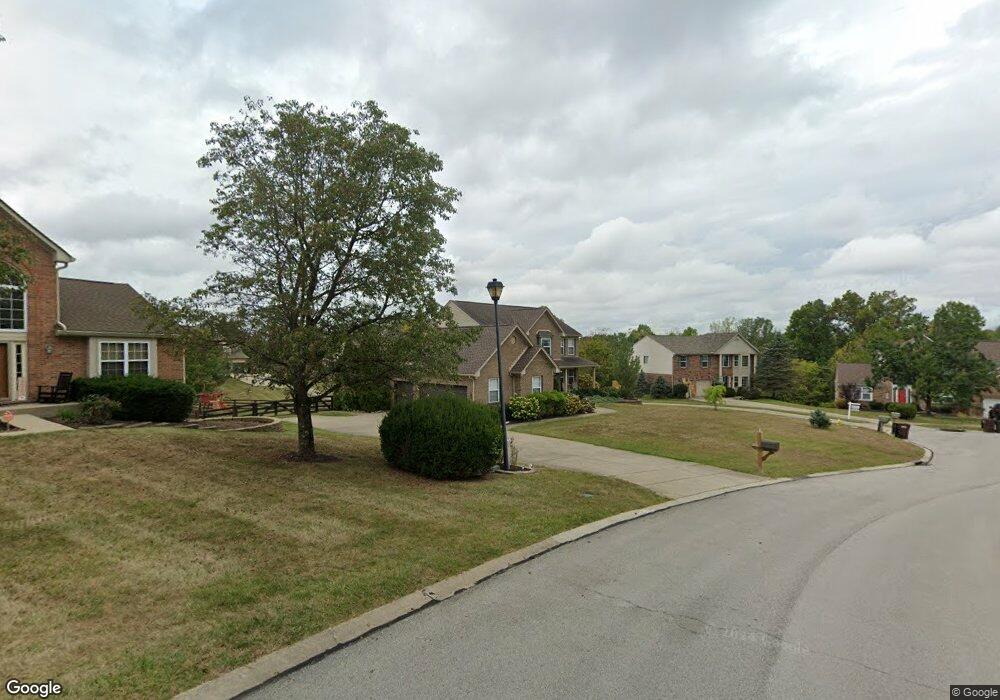
2021 Cornucopia Ct Independence, KY 41051
Estimated Value: $397,000 - $454,000
6
Beds
5
Baths
2,676
Sq Ft
$159/Sq Ft
Est. Value
About This Home
This home is located at 2021 Cornucopia Ct, Independence, KY 41051 and is currently estimated at $426,657, approximately $159 per square foot. 2021 Cornucopia Ct is a home located in Kenton County with nearby schools including Simon Kenton High School, St. Cecilia Catholic School, and Calvary Christian School.
Ownership History
Date
Name
Owned For
Owner Type
Purchase Details
Closed on
Aug 26, 2019
Sold by
Richardson Thomas P and Richardson Jennifer Y
Bought by
Sturm Bartholomew P and Sturm Courtney M
Current Estimated Value
Home Financials for this Owner
Home Financials are based on the most recent Mortgage that was taken out on this home.
Original Mortgage
$252,800
Outstanding Balance
$220,907
Interest Rate
3.8%
Mortgage Type
New Conventional
Estimated Equity
$205,750
Purchase Details
Closed on
May 27, 2003
Sold by
Wolf Pamelah and Wolf Tom
Bought by
Richardson Thomas P and Richardson Jennifer Y
Home Financials for this Owner
Home Financials are based on the most recent Mortgage that was taken out on this home.
Original Mortgage
$130,000
Interest Rate
5.79%
Mortgage Type
Purchase Money Mortgage
Purchase Details
Closed on
Jan 18, 2000
Sold by
Finke Homes Inc
Bought by
Wolf Pamelah A
Create a Home Valuation Report for This Property
The Home Valuation Report is an in-depth analysis detailing your home's value as well as a comparison with similar homes in the area
Home Values in the Area
Average Home Value in this Area
Purchase History
| Date | Buyer | Sale Price | Title Company |
|---|---|---|---|
| Sturm Bartholomew P | $316,000 | Homestead Title Agency Ltd | |
| Richardson Thomas P | $266,700 | -- | |
| Wolf Pamelah A | $250,000 | -- |
Source: Public Records
Mortgage History
| Date | Status | Borrower | Loan Amount |
|---|---|---|---|
| Open | Sturm Bartholomew P | $252,800 | |
| Previous Owner | Richardson Thomas P | $130,000 |
Source: Public Records
Tax History
| Year | Tax Paid | Tax Assessment Tax Assessment Total Assessment is a certain percentage of the fair market value that is determined by local assessors to be the total taxable value of land and additions on the property. | Land | Improvement |
|---|---|---|---|---|
| 2025 | $3,897 | $335,100 | $45,000 | $290,100 |
| 2024 | $3,871 | $316,000 | $30,000 | $286,000 |
| 2023 | $3,988 | $316,000 | $30,000 | $286,000 |
| 2022 | $4,039 | $316,000 | $30,000 | $286,000 |
| 2021 | $4,099 | $316,000 | $30,000 | $286,000 |
| 2020 | $4,186 | $316,000 | $30,000 | $286,000 |
| 2019 | $3,206 | $240,000 | $30,000 | $210,000 |
| 2018 | $3,223 | $240,000 | $30,000 | $210,000 |
| 2017 | $3,135 | $240,000 | $30,000 | $210,000 |
| 2015 | $3,049 | $240,000 | $32,000 | $208,000 |
| 2014 | $3,006 | $240,000 | $32,000 | $208,000 |
Source: Public Records
Map
Nearby Homes
- 4828 Far Hills Dr
- 1884 Bridle Path
- 4758 Fowler Creek Rd
- 1365 Cairns Ct
- 2037 Patriot Way
- 4358 Siffel Ct
- 9964 Meadow Glen Dr
- 3852 Sherbourne Dr
- 111 Green Hill Dr
- 9980 Meadow Glen Dr
- 3981 Sherbourne Dr
- 9971 Meadow Glen Dr
- 2059 Gribble Dr
- 5220 Cody Rd
- 10008 Meadow Glen Dr
- 3828 Sherbourne Dr
- 38 Waterside Way
- 1468 Shirepeak Way
- 1443 Shirepeak Way
- 3042 Sugar Camp Rd
- 2025 Cornucopia Ct
- 2009 Cornucopia Ct
- 2013 Cornucopia Ct
- 2017 Cornucopia Ct
- 2029 Cornucopia Ct
- 4907 Open Meadow Dr
- 4897 Open Meadow Dr
- 4906 Corn Row Ct
- 2005 Cornucopia Ct
- 4891 Open Meadow Dr
- 4911 Open Meadow Dr
- 4902 Open Meadow Dr
- 4911 Corn Row Ct
- 4910 Corn Row Ct
- 2018 Cornucopia Ct
- 4906 Open Meadow Dr
- 4898 Open Meadow Dr
- 4894 Open Meadow Dr
- 4908 Far Hills Dr
- 4887 Open Meadow Dr
Your Personal Tour Guide
Ask me questions while you tour the home.