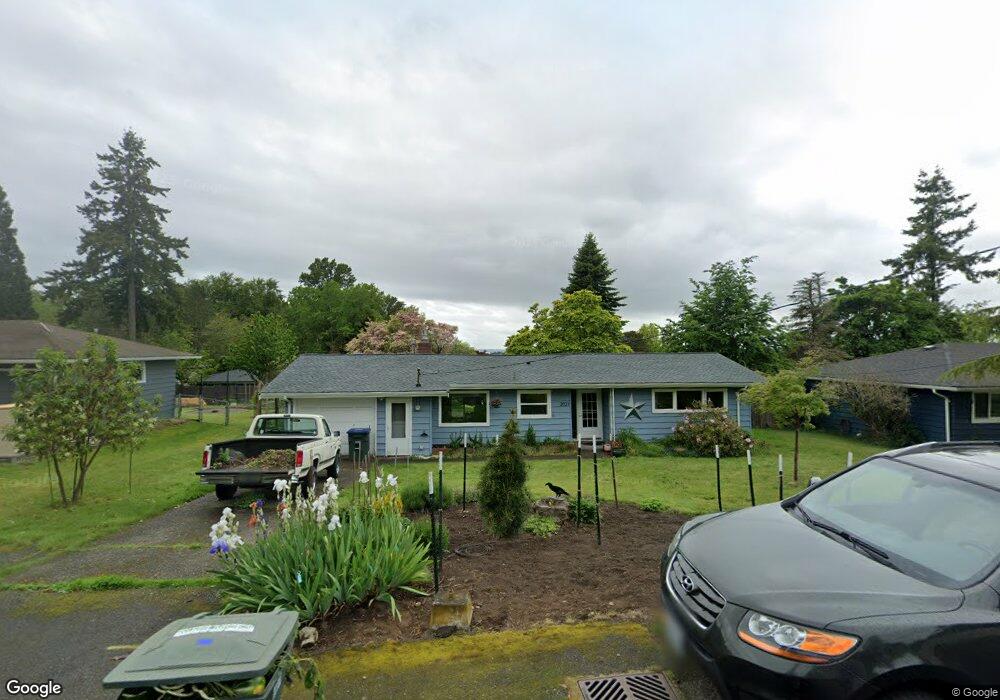
2021 Huron St Bellingham, WA 98229
Alabama Hill NeighborhoodEstimated Value: $551,000 - $642,000
2
Beds
1
Bath
998
Sq Ft
$602/Sq Ft
Est. Value
About This Home
This home is located at 2021 Huron St, Bellingham, WA 98229 and is currently estimated at $600,312, approximately $601 per square foot. 2021 Huron St is a home located in Whatcom County with nearby schools including Roosevelt Elementary School, Kulshan Middle School, and Bellingham High School.
Ownership History
Date
Name
Owned For
Owner Type
Purchase Details
Closed on
Jul 1, 2008
Sold by
Kennedy Holly Louise and Sharf Holly L
Bought by
Pedack Erin J
Current Estimated Value
Home Financials for this Owner
Home Financials are based on the most recent Mortgage that was taken out on this home.
Original Mortgage
$220,000
Outstanding Balance
$139,579
Interest Rate
6%
Mortgage Type
Purchase Money Mortgage
Estimated Equity
$460,733
Purchase Details
Closed on
Sep 15, 2006
Sold by
Jones Diane S
Bought by
Sharf Roger E and Sharf Holly L
Home Financials for this Owner
Home Financials are based on the most recent Mortgage that was taken out on this home.
Original Mortgage
$150,000
Interest Rate
6.53%
Mortgage Type
Purchase Money Mortgage
Purchase Details
Closed on
Jul 19, 2006
Sold by
Jones Brian G
Bought by
Jones Diane S
Home Financials for this Owner
Home Financials are based on the most recent Mortgage that was taken out on this home.
Original Mortgage
$150,000
Interest Rate
6.53%
Mortgage Type
Purchase Money Mortgage
Purchase Details
Closed on
Apr 10, 2000
Sold by
Robinson Diane M
Bought by
Jones Brian G and Jones Diane S
Home Financials for this Owner
Home Financials are based on the most recent Mortgage that was taken out on this home.
Original Mortgage
$123,975
Interest Rate
8.24%
Create a Home Valuation Report for This Property
The Home Valuation Report is an in-depth analysis detailing your home's value as well as a comparison with similar homes in the area
Home Values in the Area
Average Home Value in this Area
Purchase History
| Date | Buyer | Sale Price | Title Company |
|---|---|---|---|
| Pedack Erin J | $275,280 | Whatcom Land Title | |
| Sharf Roger E | $265,180 | Whatcom Land Title | |
| Jones Diane S | -- | None Available | |
| Jones Brian G | $130,500 | Island Title Company |
Source: Public Records
Mortgage History
| Date | Status | Borrower | Loan Amount |
|---|---|---|---|
| Open | Pedack Erin J | $220,000 | |
| Previous Owner | Sharf Roger E | $150,000 | |
| Previous Owner | Jones Brian G | $123,975 |
Source: Public Records
Tax History
| Year | Tax Paid | Tax Assessment Tax Assessment Total Assessment is a certain percentage of the fair market value that is determined by local assessors to be the total taxable value of land and additions on the property. | Land | Improvement |
|---|---|---|---|---|
| 2025 | $4,227 | $547,167 | $252,108 | $295,059 |
| 2024 | $4,195 | $516,187 | $237,834 | $278,353 |
| 2023 | $4,195 | $538,885 | $248,292 | $290,593 |
| 2022 | $3,629 | $472,706 | $217,800 | $254,906 |
| 2021 | $2,940 | $390,666 | $180,000 | $210,666 |
| 2020 | $2,842 | $298,690 | $144,087 | $154,603 |
| 2019 | $2,543 | $279,116 | $134,726 | $144,390 |
| 2018 | $2,631 | $250,354 | $120,851 | $129,503 |
| 2017 | $2,289 | $221,515 | $106,930 | $114,585 |
| 2016 | $2,093 | $201,375 | $97,310 | $104,065 |
| 2015 | $1,863 | $191,751 | $92,500 | $99,251 |
| 2014 | -- | $165,097 | $77,400 | $87,697 |
| 2013 | -- | $158,501 | $75,000 | $83,501 |
Source: Public Records
Map
Nearby Homes
- 2109 Ontario St
- 2409 Huron St
- 950 Yew St
- 2124 Woburn St
- 2138 Woburn St
- 2304 Crestline Dr
- 2104 Birch Cir Unit 5C
- 1803 Woburn St
- 2603 Vining St
- 2609 Vining St
- 2330 Verona St
- 2720 Niagara St
- 1321 Roland St
- 2735 Michigan St
- 1323 Roland St
- 1335 Birch St
- 2728 Xenia St
- 1305 W Clearbrook Dr Unit 22
- 3855 Fraser St
- 0 US Highway 27 Hwy N Unit MFRO6376475
Your Personal Tour Guide
Ask me questions while you tour the home.