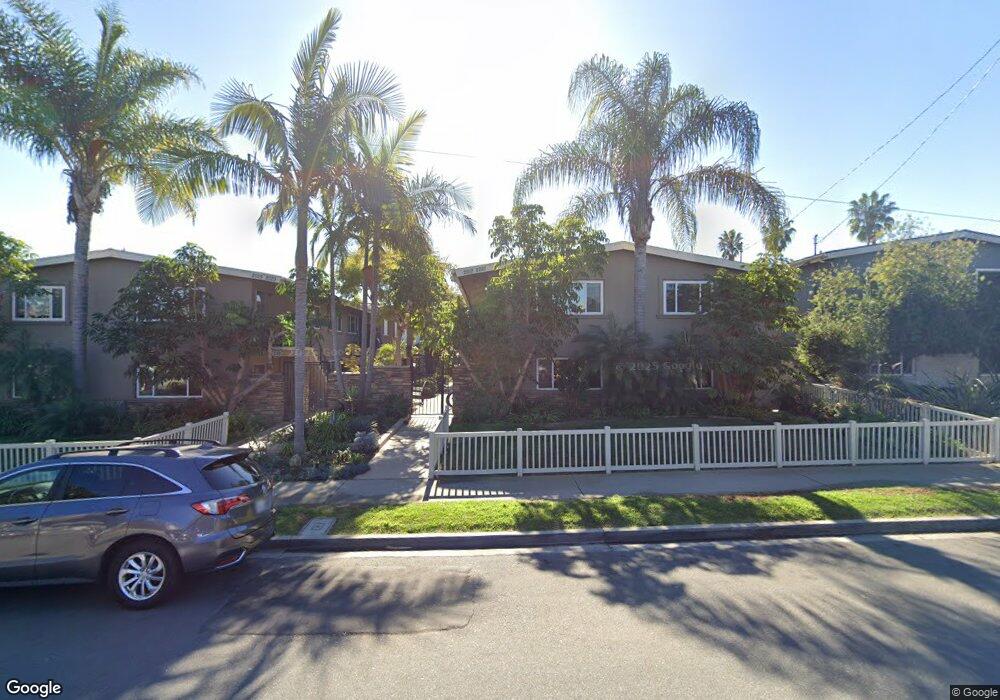
2021 Oliver Ave Unit 1 San Diego, CA 92109
Pacific Beach NeighborhoodEstimated Value: $658,852 - $766,000
2
Beds
1
Bath
788
Sq Ft
$902/Sq Ft
Est. Value
About This Home
This home is located at 2021 Oliver Ave Unit 1, San Diego, CA 92109 and is currently estimated at $710,963, approximately $902 per square foot. 2021 Oliver Ave Unit 1 is a home located in San Diego County with nearby schools including Crown Point Junior Music Academy, Pacific Beach Middle, and Mission Bay High School.
Ownership History
Date
Name
Owned For
Owner Type
Purchase Details
Closed on
Aug 19, 2024
Sold by
Kepner Katie
Bought by
Winchester John Lewis and Winchester John Lewis
Current Estimated Value
Home Financials for this Owner
Home Financials are based on the most recent Mortgage that was taken out on this home.
Original Mortgage
$500,000
Outstanding Balance
$494,244
Interest Rate
6.78%
Mortgage Type
New Conventional
Estimated Equity
$216,719
Purchase Details
Closed on
Jun 2, 2013
Sold by
Adams Ryan and Adams Ericka
Bought by
Kepner Katie
Home Financials for this Owner
Home Financials are based on the most recent Mortgage that was taken out on this home.
Original Mortgage
$299,250
Interest Rate
3.98%
Mortgage Type
New Conventional
Purchase Details
Closed on
Apr 14, 2008
Sold by
Federal Home Loan Mortgage Corporation
Bought by
Adams Ryan and Adams Ericka
Home Financials for this Owner
Home Financials are based on the most recent Mortgage that was taken out on this home.
Original Mortgage
$270,000
Interest Rate
6%
Mortgage Type
Purchase Money Mortgage
Purchase Details
Closed on
Oct 11, 2007
Sold by
Dalay Marilou
Bought by
Lasalle Bank Na and First Franklin Mortgage Loan Trust 2007-
Create a Home Valuation Report for This Property
The Home Valuation Report is an in-depth analysis detailing your home's value as well as a comparison with similar homes in the area
Home Values in the Area
Average Home Value in this Area
Purchase History
| Date | Buyer | Sale Price | Title Company |
|---|---|---|---|
| Winchester John Lewis | $700,000 | Fidelity National Title | |
| Kepner Katie | $330,000 | Title 365 | |
| Adams Ryan | $300,000 | First American Title Company | |
| Lasalle Bank Na | $328,904 | Accommodation |
Source: Public Records
Mortgage History
| Date | Status | Borrower | Loan Amount |
|---|---|---|---|
| Open | Winchester John Lewis | $500,000 | |
| Previous Owner | Kepner Katie | $299,250 | |
| Previous Owner | Adams Ryan | $270,000 |
Source: Public Records
Tax History Compared to Growth
Tax History
| Year | Tax Paid | Tax Assessment Tax Assessment Total Assessment is a certain percentage of the fair market value that is determined by local assessors to be the total taxable value of land and additions on the property. | Land | Improvement |
|---|---|---|---|---|
| 2025 | $4,816 | $700,000 | $512,068 | $187,932 |
| 2024 | $4,816 | $396,592 | $290,117 | $106,475 |
| 2023 | $4,708 | $388,817 | $284,429 | $104,388 |
| 2022 | $4,582 | $381,194 | $278,852 | $102,342 |
| 2021 | $4,549 | $373,721 | $273,385 | $100,336 |
| 2020 | $4,493 | $369,890 | $270,582 | $99,308 |
| 2019 | $4,412 | $362,638 | $265,277 | $97,361 |
| 2018 | $4,124 | $355,528 | $260,076 | $95,452 |
| 2017 | $4,025 | $348,558 | $254,977 | $93,581 |
| 2016 | $3,959 | $341,725 | $249,978 | $91,747 |
| 2015 | $3,899 | $336,593 | $246,224 | $90,369 |
| 2014 | $3,837 | $330,000 | $241,401 | $88,599 |
Source: Public Records
Map
Nearby Homes
- 2023 Reed Ave Unit 1A
- 2134 Reed Ave
- 4064 Honeycutt St
- 4015 Crown Point Dr Unit 308
- 4007 Crown Point Dr Unit V15
- 1830 Thomas Ave Unit 3D
- 1300 Grand Ave Unit 38, 39
- 1956 Hornblend St Unit 8
- 4073 Kendall St Unit 2
- 3955 Honeycutt St Unit 201
- 1812 Grand Ave
- 2050 Garnet Ave
- 3968 Sequoia St
- 4036 Shasta St Unit 14
- 2346 Grand Ave
- 2114 Felspar St
- 4053-55 Jewell St
- 3955 Shasta St
- 2045 Emerald St Unit 3
- 1654 Oliver Ave Unit 6
- 2025 Oliver Ave Unit 1
- 2029 1/2 Oliver Ave Unit 1
- 2021 1/2 Oliver Ave
- 2025 1/2 Oliver Ave
- 2017 1/2 Oliver Ave
- 2029 1/2 Oliver Ave
- 2021 Oliver Ave
- 2029 Oliver Ave
- 2025 Oliver Ave Unit 2025
- 2027 1/2 Oliver Ave Unit 1
- 2027 Oliver Ave Unit 1
- 2027 1/2 Oliver Ave
- 2027 Oliver Ave
- 2019 1/2 Oliver Ave
- 2019 Oliver Ave
- 2017 Oliver Ave Unit .05
- 2017 Oliver Ave Unit 2017
- 2033 Oliver Ave Unit 1/2
- 2033 Oliver Ave Unit 1
- 2035 1/2 Oliver Ave