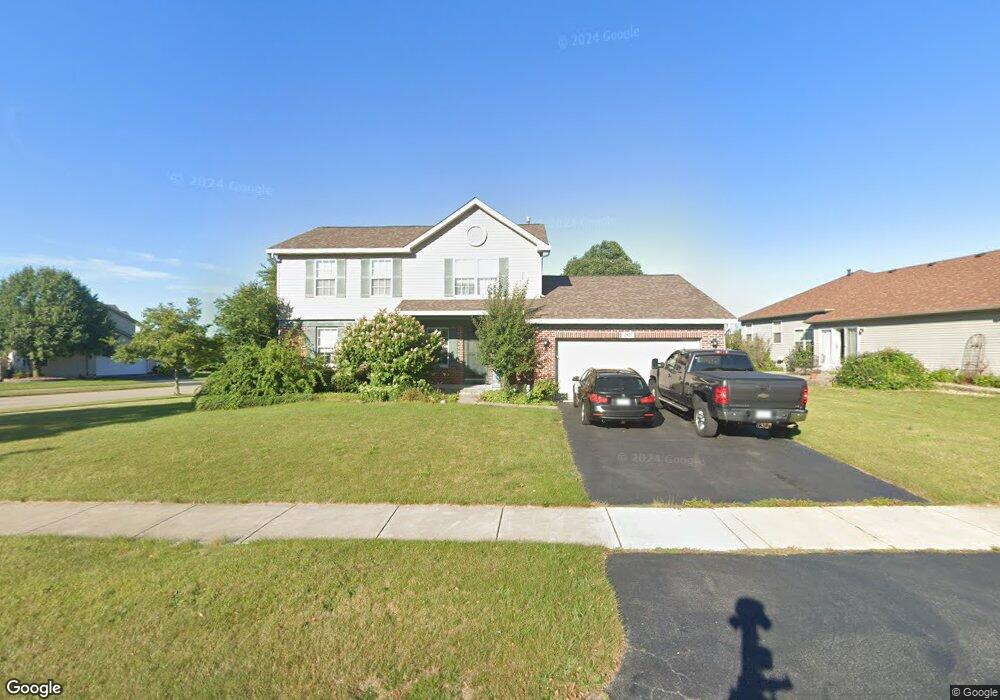
2021 Sequoia Way Lockport, IL 60441
South Lockport NeighborhoodEstimated Value: $391,000 - $419,000
4
Beds
3
Baths
2,300
Sq Ft
$176/Sq Ft
Est. Value
About This Home
This home is located at 2021 Sequoia Way, Lockport, IL 60441 and is currently estimated at $405,202, approximately $176 per square foot. 2021 Sequoia Way is a home located in Will County with nearby schools including Taft Grade School, Lockport Township High School East, and Saint Dennis School.
Ownership History
Date
Name
Owned For
Owner Type
Purchase Details
Closed on
May 5, 2017
Sold by
V Mortgage Reo 1 Llc
Bought by
Cigler Rudolph J
Current Estimated Value
Home Financials for this Owner
Home Financials are based on the most recent Mortgage that was taken out on this home.
Original Mortgage
$174,750
Interest Rate
4.37%
Mortgage Type
New Conventional
Purchase Details
Closed on
Sep 1, 2016
Sold by
Kunst Joseph J and Wilmington Trust National Asso
Bought by
V Mortgage Reo 1 Llc
Purchase Details
Closed on
Jul 30, 2013
Sold by
Kunst Joseph J
Bought by
Kunst Tina M
Purchase Details
Closed on
Mar 13, 2002
Sold by
Pine Valley Associates Llc
Bought by
Kunst Joseph J and Kunst Tina M
Home Financials for this Owner
Home Financials are based on the most recent Mortgage that was taken out on this home.
Original Mortgage
$185,000
Interest Rate
7.11%
Create a Home Valuation Report for This Property
The Home Valuation Report is an in-depth analysis detailing your home's value as well as a comparison with similar homes in the area
Home Values in the Area
Average Home Value in this Area
Purchase History
| Date | Buyer | Sale Price | Title Company |
|---|---|---|---|
| Cigler Rudolph J | $233,000 | Attorney | |
| V Mortgage Reo 1 Llc | -- | Premier Title | |
| Kunst Tina M | -- | None Available | |
| Kunst Joseph J | $210,500 | First American Title |
Source: Public Records
Mortgage History
| Date | Status | Borrower | Loan Amount |
|---|---|---|---|
| Previous Owner | Cigler Rudolph J | $174,750 | |
| Previous Owner | Kunst Joseph J | $185,000 |
Source: Public Records
Tax History Compared to Growth
Tax History
| Year | Tax Paid | Tax Assessment Tax Assessment Total Assessment is a certain percentage of the fair market value that is determined by local assessors to be the total taxable value of land and additions on the property. | Land | Improvement |
|---|---|---|---|---|
| 2024 | $8,824 | $117,835 | $26,261 | $91,574 |
| 2023 | $8,824 | $105,786 | $23,576 | $82,210 |
| 2022 | $8,155 | $99,654 | $22,209 | $77,445 |
| 2021 | $7,751 | $93,651 | $20,871 | $72,780 |
| 2020 | $7,568 | $90,572 | $20,185 | $70,387 |
| 2019 | $7,237 | $85,851 | $19,133 | $66,718 |
| 2018 | $7,403 | $85,851 | $19,133 | $66,718 |
| 2017 | $7,182 | $81,045 | $18,062 | $62,983 |
| 2016 | $6,862 | $75,956 | $16,928 | $59,028 |
| 2015 | $5,703 | $68,180 | $15,195 | $52,985 |
| 2014 | $5,703 | $63,720 | $14,201 | $49,519 |
| 2013 | $5,703 | $63,720 | $14,201 | $49,519 |
Source: Public Records
Map
Nearby Homes
- 1914 S Austrian Pine St Unit 2
- 17045 Sterling Dr
- 2021 Princess Ct
- 2009 Princess Ct
- 2005 Princess Ct
- 1623 East St
- 516 Whelan St
- 1513 Connor Ave
- 17340 Lucerne Ct
- 1212 Grandview Ave
- 1525 Peachtree Ln Unit 2
- 1526 Peachtree Ln
- 818 E 11th St
- 17228 Como Ave
- 17120 Carlislie Ln
- 1105 E Division St Unit 1B
- 2004 Boehme St
- 202 E 14th St
- 17113 Manitoba
- 17129 Manitoba St
- 2013 Sequoia Way
- 714 Parkview Ln
- 729 Parkview Ln
- 2102 Fir Ct
- 738 Parkview Ln
- 706 Parkview Ln
- 2010 Sequoia Way
- 2016 Scotch Pine Ct
- 1921 Sequoia Way
- 2002 Sequoia Way
- 2110 Fir Ct
- 746 Parkview Ln
- 2100 Sequoia Ct
- 2103 Fir Ct
- 2109 Sequoia Ct
- 2008 Scotch Pine Ct
- 2118 Fir Ct
- 1916 Sequoia Way
- 1927 Jack Pine Way
- 1913 Sequoia Way