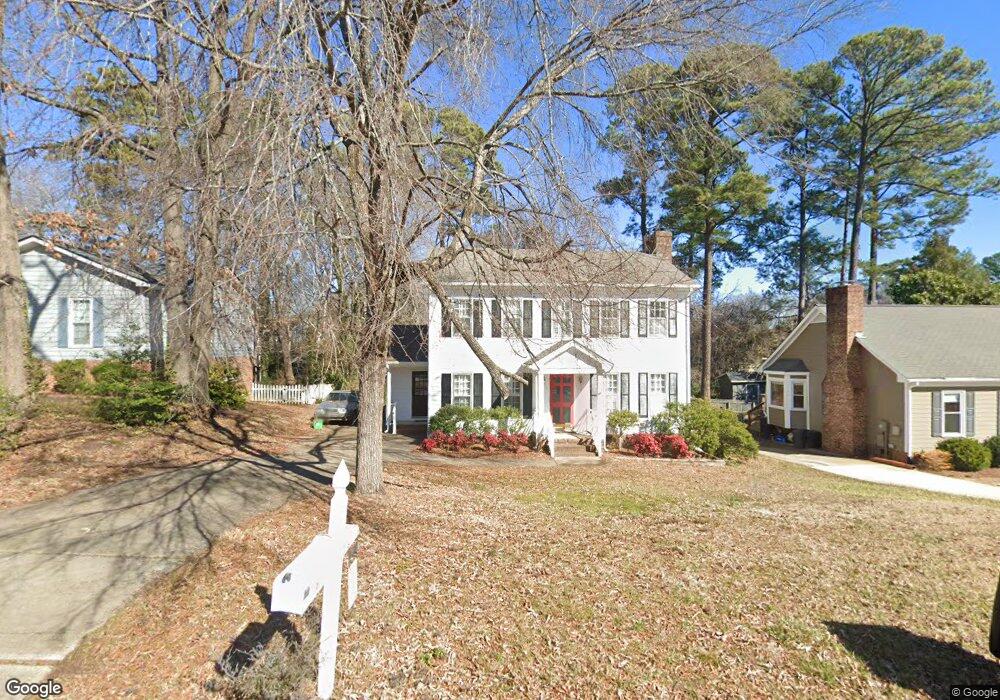
2021 Travianna Ct Raleigh, NC 27609
Estimated Value: $420,000 - $465,000
3
Beds
3
Baths
1,774
Sq Ft
$251/Sq Ft
Est. Value
About This Home
This home is located at 2021 Travianna Ct, Raleigh, NC 27609 and is currently estimated at $445,587, approximately $251 per square foot. 2021 Travianna Ct is a home located in Wake County with nearby schools including Millbrook Elementary School, East Millbrook Middle, and Millbrook High School.
Ownership History
Date
Name
Owned For
Owner Type
Purchase Details
Closed on
Sep 25, 2021
Sold by
Platt Liudmila Fedorovna and Platt Rorin M
Bought by
Platt Liudmila Fedorovna and Konovalov Vladimir
Current Estimated Value
Home Financials for this Owner
Home Financials are based on the most recent Mortgage that was taken out on this home.
Original Mortgage
$100,000
Outstanding Balance
$76,844
Interest Rate
2.1%
Mortgage Type
New Conventional
Estimated Equity
$368,743
Purchase Details
Closed on
Sep 17, 2016
Sold by
Platt Robin M
Bought by
Platt Robin M and Platt Liudmila Fedorovna
Purchase Details
Closed on
Oct 15, 2004
Sold by
Barbour Willard R and Barbour Emily A
Bought by
Platt Rorin M
Home Financials for this Owner
Home Financials are based on the most recent Mortgage that was taken out on this home.
Original Mortgage
$143,100
Interest Rate
5.71%
Mortgage Type
Purchase Money Mortgage
Create a Home Valuation Report for This Property
The Home Valuation Report is an in-depth analysis detailing your home's value as well as a comparison with similar homes in the area
Home Values in the Area
Average Home Value in this Area
Purchase History
| Date | Buyer | Sale Price | Title Company |
|---|---|---|---|
| Platt Liudmila Fedorovna | -- | Avenue 365 Lender Svcs Llc R | |
| Platt Liudmila Fedorovna | -- | None Listed On Document | |
| Platt Robin M | -- | None Available | |
| Platt Rorin M | $179,000 | -- |
Source: Public Records
Mortgage History
| Date | Status | Borrower | Loan Amount |
|---|---|---|---|
| Open | Platt Liudmila Fedorovna | $100,000 | |
| Closed | Platt Liudmila Fedorovna | $10,000 | |
| Previous Owner | Platt Rorin M | $143,100 | |
| Closed | Platt Rorin M | $17,800 |
Source: Public Records
Tax History Compared to Growth
Tax History
| Year | Tax Paid | Tax Assessment Tax Assessment Total Assessment is a certain percentage of the fair market value that is determined by local assessors to be the total taxable value of land and additions on the property. | Land | Improvement |
|---|---|---|---|---|
| 2025 | $3,885 | $443,151 | $200,000 | $243,151 |
| 2024 | $3,869 | $443,151 | $200,000 | $243,151 |
| 2023 | $3,187 | $290,539 | $130,000 | $160,539 |
| 2022 | $2,962 | $290,539 | $130,000 | $160,539 |
| 2021 | $2,847 | $290,539 | $130,000 | $160,539 |
| 2020 | $2,795 | $290,539 | $130,000 | $160,539 |
| 2019 | $2,363 | $202,200 | $80,000 | $122,200 |
| 2018 | $2,229 | $202,200 | $80,000 | $122,200 |
| 2017 | $2,123 | $202,200 | $80,000 | $122,200 |
| 2016 | $2,080 | $202,200 | $80,000 | $122,200 |
| 2015 | $2,027 | $193,799 | $68,000 | $125,799 |
| 2014 | $1,923 | $193,799 | $68,000 | $125,799 |
Source: Public Records
Map
Nearby Homes
- 1717 Falls Church Rd
- 1707 Falls Church Rd
- 1524 Edgeside Ct
- 6309 Johnsdale Rd
- 5812 Old Forge Cir
- 5718 Sentinel Dr
- 5721 Timber Ridge Dr
- 5810 Shady Grove Cir
- 1516 Hemphill Dr
- 6311 Johnsdale Rd
- 6844 Greystone Dr
- 1401 Spring Forest Rd
- 6904 Aspen Ct
- 1782 Quail Ridge Rd
- 6016 Volant Dr
- 2031 Township Cir
- 1776 Quail Ridge Rd
- 5604 Windy Hollow Ct
- 1220 Manassas Ct Unit B
- 1738 Quail Ridge Rd
- 2025 Travianna Ct
- 2013 Travianna Ct
- 2029 Travianna Ct
- 2020 Bason Ct
- 2024 Bason Ct
- 2016 Bason Ct
- 2016 Travianna Ct
- 2012 Travianna Ct
- 2009 Travianna Ct
- 2020 Travianna Ct
- 2012 Bason Ct
- 2008 Travianna Ct
- 2005 Travianna Ct
- 2204 Quail Ridge Rd
- 2001 Travianna Ct
- 2008 Bason Ct
- 2021 Hunterfield Ln
- 2117 Quail Ridge Rd
- 2200 Quail Ridge Rd
- 2017 Hunterfield Ln