
Seller's Agent in 2020
Brenda Williams
Coldwell Banker Realty - Greater Northwest
(281) 794-1415
22 Total Sales

Estimated Value: $409,000 - $443,000
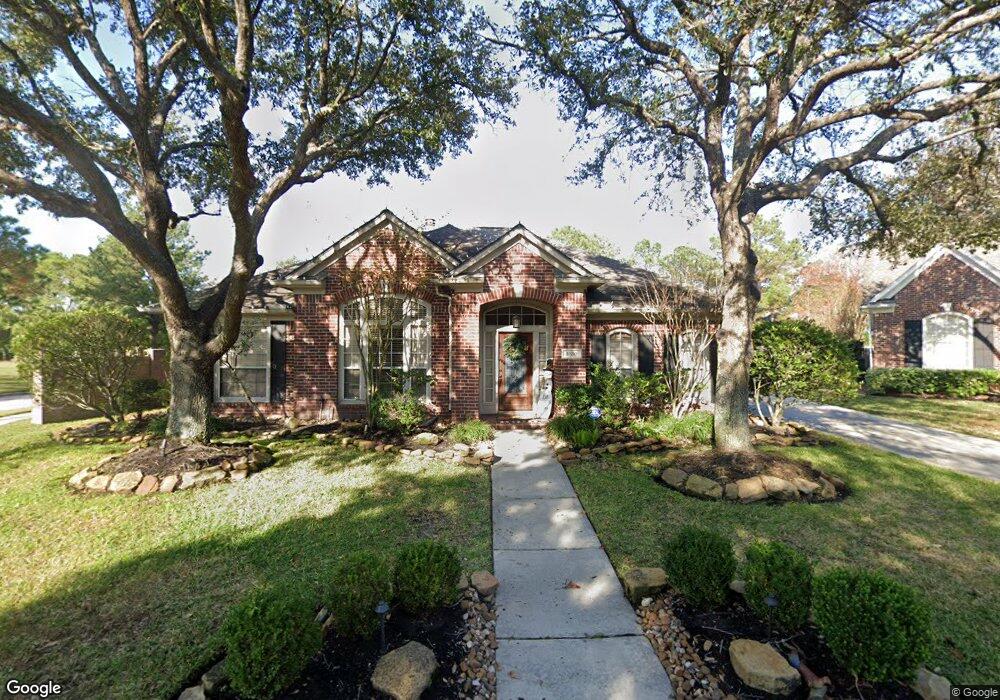
Spectacular, Upscale Home with Tropical Backyard Paradise, Pool, Rock Waterfall, Spa, Outdoor Kitchen & Mega Updates Throughout! New Roof 2015, Resurfaced Pool 2017, Remodeled Kitchen & Baths, Extensive Wide Plank Floors, Outdoor Carvestone Patio, 2012-2020, HVAC 2010, 8'x10' Climatized Rm/Garage 2016, Water Heater. Beautiful Leaded Glass Front Door Leads to Impressive Foyer, Flanked by Elegant Living & Dining Rooms w/Crown Molding & High Ceilings. Spacious Great Rm with Double Fireplace to Library,Views Beautiful Backyard Through Tall Windows. Chef's Kitchen Loaded with 42"Cabinets Freshly Painted Inside & Out, Granite Counters, Stainless Appliances & L- Shaped Serving Bar for Entertaining. Elegant Master w/Sitting Rm & En-suite Bath Remodeled with Seamless Glass Shower, Deco Tile, Granite, Fixtures, Hardware! Handsome Library w/Dual Fireplace; Snazzy Granite Powder Rm. Windrose Boasts 18 Hole Golf Course, Club House w/Grill, Lake, Sidewalks, Parks, Pools, Highly Acclaimed Klein ISD!
Last Agent to Sell the Property
Coldwell Banker Realty - Greater Northwest License #0393325 Listed on: 06/08/2020
Last Buyer's Agent
Better Homes and Gardens Real Estate Gary Greene - Lake Conroe South License #0595381
| Date | Buyer | Sale Price | Title Company |
|---|---|---|---|
| Brown Andrew | -- | Texas American Title Company | |
| Meninger Richard G | -- | Chicago Title Insurance Comp | |
| Burton Mark S | -- | Regency Title |
| Date | Status | Borrower | Loan Amount |
|---|---|---|---|
| Open | Brown Andrew | $326,800 | |
| Previous Owner | Meninger Richard G | $180,800 | |
| Previous Owner | Burton Mark S | $141,450 | |
| Closed | Meninger Richard G | $33,900 |
| Date | Event | Price | List to Sale | Price per Sq Ft |
|---|---|---|---|---|
| 06/15/2025 06/15/25 | Off Market | -- | -- | -- |
| 07/13/2020 07/13/20 | Sold | -- | -- | -- |
| 06/13/2020 06/13/20 | Pending | -- | -- | -- |
| 06/08/2020 06/08/20 | For Sale | $350,000 | -- | $136 / Sq Ft |
| Year | Tax Paid | Tax Assessment Tax Assessment Total Assessment is a certain percentage of the fair market value that is determined by local assessors to be the total taxable value of land and additions on the property. | Land | Improvement |
|---|---|---|---|---|
| 2025 | $7,723 | $409,899 | $66,056 | $343,843 |
| 2024 | $7,723 | $400,503 | $66,056 | $334,447 |
| 2023 | $7,723 | $368,164 | $66,056 | $302,108 |
| 2022 | $8,824 | $370,671 | $66,056 | $304,615 |
| 2021 | $8,589 | $320,900 | $49,542 | $271,358 |
| 2020 | $8,031 | $282,902 | $49,542 | $233,360 |
| 2019 | $8,408 | $286,129 | $49,829 | $236,300 |
| 2018 | $2,413 | $273,105 | $45,558 | $227,547 |
| 2017 | $8,037 | $273,105 | $45,558 | $227,547 |
| 2016 | $7,910 | $268,778 | $45,558 | $223,220 |
| 2015 | $4,746 | $268,778 | $45,558 | $223,220 |
| 2014 | $4,746 | $244,582 | $45,558 | $199,024 |
Seller's Agent in 2020
Brenda Williams
Coldwell Banker Realty - Greater Northwest
(281) 794-1415
22 Total Sales
Buyer's Agent in 2020
Cameo Bua-Clements
Better Homes and Gardens Real Estate Gary Greene - Lake Conroe South
(832) 754-5805
79 Total Sales
Source: Houston Association of REALTORS®
MLS Number: 36217939
APN: 1191980020001
Disclaimer: Certain information contained herein is derived from information provided by parties other than Homes.com. All information provided is deemed reliable, but is not guaranteed to be accurate and should be independently verified.
![]() Copyright 2026, Houston REALTORS® Information Service, Inc.
Copyright 2026, Houston REALTORS® Information Service, Inc.
The information provided is exclusively for consumers’ personal, non-commercial use, and may not be used for any purpose other than to identify prospective properties consumers may be interested in purchasing.
Information is deemed reliable but not guaranteed.
Ask me questions while you tour the home.