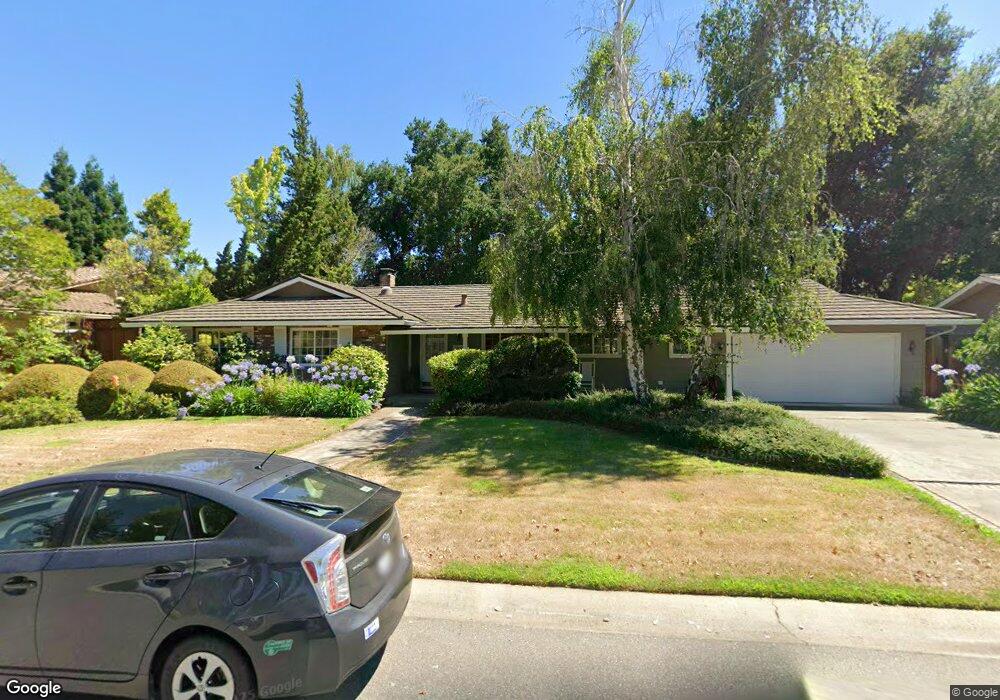
20218 Pierce Rd Saratoga, CA 95070
The Golden Triangle NeighborhoodEstimated Value: $4,032,000 - $4,397,000
4
Beds
4
Baths
2,000
Sq Ft
$2,117/Sq Ft
Est. Value
About This Home
This home is located at 20218 Pierce Rd, Saratoga, CA 95070 and is currently estimated at $4,234,967, approximately $2,117 per square foot. 20218 Pierce Rd is a home located in Santa Clara County with nearby schools including Argonaut Elementary School, Foothill Elementary School, and Saratoga Elementary School.
Ownership History
Date
Name
Owned For
Owner Type
Purchase Details
Closed on
Apr 19, 2006
Sold by
Perera Wirendre A and Perera Jane
Bought by
Perera Wirendre A and Perera Jane
Current Estimated Value
Purchase Details
Closed on
Sep 22, 1994
Sold by
Nesenblatt Neil and Nesenblatt Lydia Ramos
Bought by
Perera Wirendre A and Perera Jane
Home Financials for this Owner
Home Financials are based on the most recent Mortgage that was taken out on this home.
Original Mortgage
$350,000
Interest Rate
6.25%
Purchase Details
Closed on
Apr 29, 1994
Sold by
Karlinsky Stewart S and Karlinsky Hilary
Bought by
Nesenblatt Neil and Nesenblatt Lydia Ramos
Home Financials for this Owner
Home Financials are based on the most recent Mortgage that was taken out on this home.
Original Mortgage
$350,000
Interest Rate
4.5%
Create a Home Valuation Report for This Property
The Home Valuation Report is an in-depth analysis detailing your home's value as well as a comparison with similar homes in the area
Home Values in the Area
Average Home Value in this Area
Purchase History
| Date | Buyer | Sale Price | Title Company |
|---|---|---|---|
| Perera Wirendre A | -- | None Available | |
| Perera Wirendre A | $575,000 | Old Republic Title Company | |
| Nesenblatt Neil | $510,000 | North American Title Co Inc |
Source: Public Records
Mortgage History
| Date | Status | Borrower | Loan Amount |
|---|---|---|---|
| Closed | Perera Wirendre A | $350,000 | |
| Previous Owner | Nesenblatt Neil | $350,000 |
Source: Public Records
Tax History Compared to Growth
Tax History
| Year | Tax Paid | Tax Assessment Tax Assessment Total Assessment is a certain percentage of the fair market value that is determined by local assessors to be the total taxable value of land and additions on the property. | Land | Improvement |
|---|---|---|---|---|
| 2025 | $13,206 | $1,066,166 | $434,529 | $631,637 |
| 2024 | $13,206 | $1,045,261 | $426,009 | $619,252 |
| 2023 | $13,004 | $1,024,766 | $417,656 | $607,110 |
| 2022 | $12,716 | $1,004,673 | $409,467 | $595,206 |
| 2021 | $12,497 | $984,975 | $401,439 | $583,536 |
| 2020 | $12,169 | $974,876 | $397,323 | $577,553 |
| 2019 | $11,930 | $955,762 | $389,533 | $566,229 |
| 2018 | $11,682 | $937,023 | $381,896 | $555,127 |
| 2017 | $11,614 | $918,651 | $374,408 | $544,243 |
| 2016 | $11,267 | $900,639 | $367,067 | $533,572 |
| 2015 | $11,039 | $887,112 | $361,554 | $525,558 |
| 2014 | $10,801 | $869,736 | $354,472 | $515,264 |
Source: Public Records
Map
Nearby Homes
- 12790 Glen Arbor Ct
- 20077 Ljepava Dr
- 19662 Via Grande Dr
- 18396 Mill Ct
- 13010 Glen Brae Dr
- 19522 Via Real Dr
- 19920 Viewridge Dr
- 20410 Thelma Ave
- 19437 Via Real Dr
- 20811 Norada Ct
- 20717 Meadow Oak Rd
- 12359 Farr Ranch Rd
- 19938 Baroni Ct
- 1681 Danromas Way
- 13845 Saratoga Ave
- 19423 Vineyard Ln
- 1587 Miller Ave
- 20557 Deerpark Ct
- 19113 Vineyard Ln
- 6923 Chantel Ct Unit 92
- 20236 Pierce Rd
- 20200 Pierce Rd
- 20221 Chateau Dr
- 20201 Chateau Dr
- 20181 Chateau Dr
- 20211 Pierce Rd
- 20254 Pierce Rd
- 20184 Pierce Rd
- 20227 Pierce Rd
- 20241 Chateau Dr
- 20195 Pierce Rd
- 20175 Chateau Dr
- 20243 Pierce Rd
- 20272 Pierce Rd
- 20168 Pierce Rd
- 12791 Ione Ct
- 20171 Pierce Rd
- 20261 Chateau Dr
- 12790 Ione Ct
- 20169 Chateau Dr