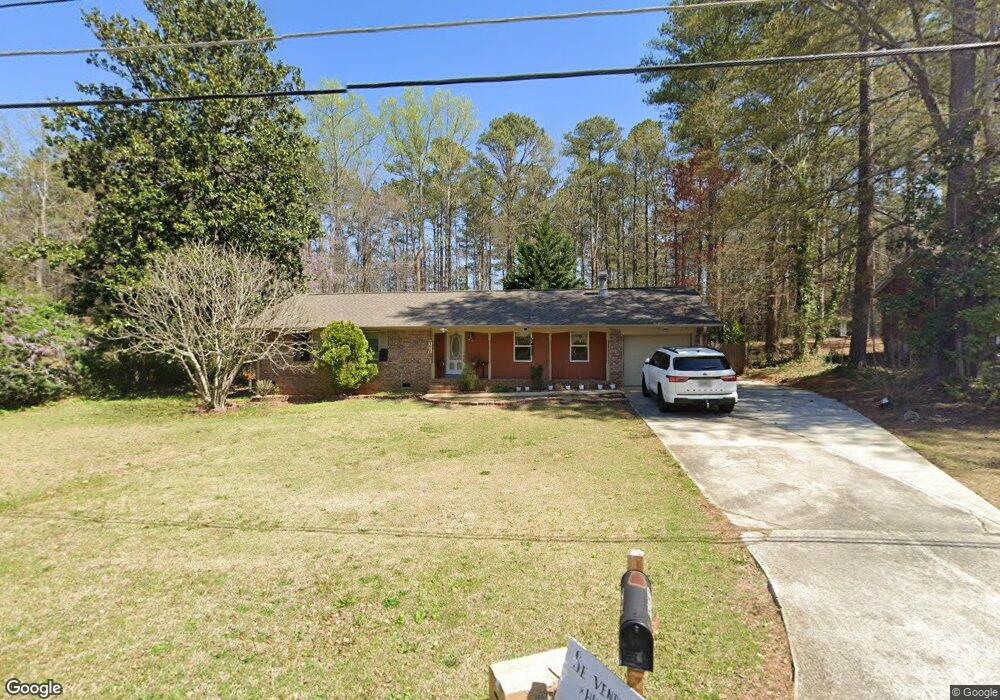
2022 Devore Dr SW Marietta, GA 30008
Southwestern Marietta NeighborhoodEstimated Value: $271,000 - $292,002
3
Beds
2
Baths
1,327
Sq Ft
$216/Sq Ft
Est. Value
About This Home
This home is located at 2022 Devore Dr SW, Marietta, GA 30008 and is currently estimated at $286,001, approximately $215 per square foot. 2022 Devore Dr SW is a home located in Cobb County with nearby schools including Hollydale Elementary School, Smitha Middle School, and Osborne High School.
Ownership History
Date
Name
Owned For
Owner Type
Purchase Details
Closed on
Mar 26, 2010
Sold by
Hud & Housing Of Urban Dev
Bought by
Martinez Jose J
Current Estimated Value
Purchase Details
Closed on
Aug 4, 2009
Sold by
Midfirst Bk
Bought by
Hud-Housing Of Urban Dev
Purchase Details
Closed on
Jul 28, 1997
Sold by
Karay Hannelore
Bought by
Maguire Barrie Anne
Home Financials for this Owner
Home Financials are based on the most recent Mortgage that was taken out on this home.
Original Mortgage
$80,400
Interest Rate
7.61%
Mortgage Type
FHA
Purchase Details
Closed on
Apr 30, 1993
Sold by
White Joseph A
Bought by
Karay Hannelore
Home Financials for this Owner
Home Financials are based on the most recent Mortgage that was taken out on this home.
Original Mortgage
$58,500
Interest Rate
7.43%
Create a Home Valuation Report for This Property
The Home Valuation Report is an in-depth analysis detailing your home's value as well as a comparison with similar homes in the area
Home Values in the Area
Average Home Value in this Area
Purchase History
| Date | Buyer | Sale Price | Title Company |
|---|---|---|---|
| Martinez Jose J | $38,500 | -- | |
| Hud-Housing Of Urban Dev | -- | -- | |
| Midfirst Bk | $98,571 | -- | |
| Maguire Barrie Anne | $81,000 | -- | |
| Karay Hannelore | $65,000 | -- |
Source: Public Records
Mortgage History
| Date | Status | Borrower | Loan Amount |
|---|---|---|---|
| Previous Owner | Maguire Barrie Anne | $80,400 | |
| Previous Owner | Karay Hannelore | $58,500 |
Source: Public Records
Tax History Compared to Growth
Tax History
| Year | Tax Paid | Tax Assessment Tax Assessment Total Assessment is a certain percentage of the fair market value that is determined by local assessors to be the total taxable value of land and additions on the property. | Land | Improvement |
|---|---|---|---|---|
| 2025 | $3,087 | $102,468 | $30,000 | $72,468 |
| 2024 | $3,089 | $102,468 | $30,000 | $72,468 |
| 2023 | $3,120 | $103,480 | $20,000 | $83,480 |
| 2022 | $2,077 | $68,432 | $14,000 | $54,432 |
| 2021 | $2,077 | $68,432 | $14,000 | $54,432 |
| 2020 | $1,959 | $64,548 | $14,000 | $50,548 |
| 2019 | $1,959 | $64,548 | $14,000 | $50,548 |
| 2018 | $1,404 | $46,268 | $11,200 | $35,068 |
| 2017 | $1,330 | $46,268 | $11,200 | $35,068 |
| 2016 | $932 | $32,404 | $11,200 | $21,204 |
| 2015 | $955 | $32,404 | $11,200 | $21,204 |
| 2014 | $757 | $25,472 | $0 | $0 |
Source: Public Records
Map
Nearby Homes
- 0 Burfordi Dr SW Unit 7658493
- 0 Burfordi Dr SW Unit 10637361
- 2060 Powder Springs Rd SW
- 1970 Powder Springs Rd SW
- 3000 Fern Valley Dr SW
- 3145 Fern Valley Dr SW
- 2720 Cold Springs Trail SW
- 2318 Powder Springs Rd SW
- 2099 Redbud Ct SW
- 3055 Milford Chase Overlook SW
- 1697 Rustic Dr SW
- 2700 Flintlock Ln SW
- 2450 Horseshoe Bend Rd SW
- 3112 Patriot Square SW
- 3100 Patriot Square SW
- 3047 Patriot Square SW
- 2126 Green Dr SW
- 2608 Foxwood Place SW Unit IV
- 2012 Devore Dr SW
- 2032 Devore Dr SW Unit 2
- 2002 Devore Dr SW
- 2002 Devore Dr SW Unit II
- 2710 Ilex Ct SW
- 2021 Devore Dr SW
- 2045 Devore Dr SW
- 2790 Valley Brook Dr SW
- 1992 Devore Dr SW Unit 18
- 1992 Devore Dr SW
- 1992 Devore Dr SW Unit II
- 2711 Ilex Ct SW
- 2701 Ilex Ct SW
- 2061 Devore Dr SW
- 2795 Valley Brook Dr SW
- 2800 Valley Brook Dr SW
- 1976 Devore Dr SW Unit II
- 2070 Devore Dr SW
- 2071 Devore Dr SW
- 1952 Devore Dr SW