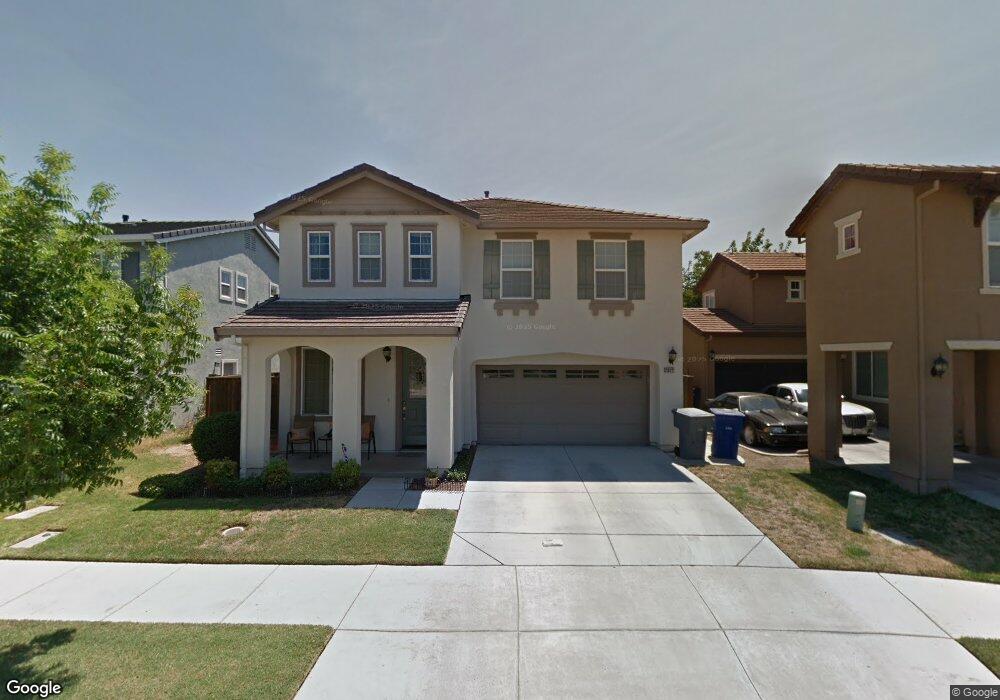
2022 Garland Ct Ceres, CA 95307
Mayfield NeighborhoodEstimated Value: $285,000 - $538,000
4
Beds
2
Baths
2,287
Sq Ft
$202/Sq Ft
Est. Value
About This Home
This home is located at 2022 Garland Ct, Ceres, CA 95307 and is currently estimated at $462,211, approximately $202 per square foot. 2022 Garland Ct is a home located in Stanislaus County with nearby schools including Samuel Vaughn Elementary School, Cesar Chavez Junior High School, and Ceres High School.
Ownership History
Date
Name
Owned For
Owner Type
Purchase Details
Closed on
Aug 31, 2009
Sold by
California Equity Management Group Inc
Bought by
Martinez Armando
Current Estimated Value
Home Financials for this Owner
Home Financials are based on the most recent Mortgage that was taken out on this home.
Original Mortgage
$206,196
Outstanding Balance
$134,851
Interest Rate
5.19%
Mortgage Type
FHA
Estimated Equity
$327,360
Purchase Details
Closed on
May 6, 2009
Sold by
Leon Oscar N
Bought by
California Equity Management Group Inc
Purchase Details
Closed on
Jun 2, 2005
Sold by
Ceg Partners Llc
Bought by
Leon Oscar N and Piraquive Olga
Home Financials for this Owner
Home Financials are based on the most recent Mortgage that was taken out on this home.
Original Mortgage
$350,534
Interest Rate
6.9%
Mortgage Type
Purchase Money Mortgage
Create a Home Valuation Report for This Property
The Home Valuation Report is an in-depth analysis detailing your home's value as well as a comparison with similar homes in the area
Home Values in the Area
Average Home Value in this Area
Purchase History
| Date | Buyer | Sale Price | Title Company |
|---|---|---|---|
| Martinez Armando | -- | Old Republic Title Company | |
| California Equity Management Group Inc | $152,000 | None Available | |
| Leon Oscar N | $438,500 | Chicago Title Co |
Source: Public Records
Mortgage History
| Date | Status | Borrower | Loan Amount |
|---|---|---|---|
| Open | Martinez Armando | $206,196 | |
| Previous Owner | Leon Oscar N | $350,534 |
Source: Public Records
Tax History Compared to Growth
Tax History
| Year | Tax Paid | Tax Assessment Tax Assessment Total Assessment is a certain percentage of the fair market value that is determined by local assessors to be the total taxable value of land and additions on the property. | Land | Improvement |
|---|---|---|---|---|
| 2024 | $3,366 | $265,743 | $75,923 | $189,820 |
| 2023 | $3,270 | $260,534 | $74,435 | $186,099 |
| 2022 | $3,227 | $255,426 | $72,976 | $182,450 |
| 2021 | $3,165 | $250,419 | $71,546 | $178,873 |
| 2020 | $3,077 | $247,852 | $70,813 | $177,039 |
| 2019 | $3,056 | $242,993 | $69,425 | $173,568 |
| 2018 | $2,986 | $238,229 | $68,064 | $170,165 |
| 2017 | $2,953 | $233,559 | $66,730 | $166,829 |
| 2016 | $2,888 | $228,980 | $65,422 | $163,558 |
| 2015 | $2,846 | $225,542 | $64,440 | $161,102 |
| 2014 | $2,785 | $221,125 | $63,178 | $157,947 |
Source: Public Records
Map
Nearby Homes
- 1812 Monterey Pine Ave
- 1813 Poppy Ln
- 3786 Waynesboro Dr
- 2208 Giant Oak Ln
- 3929 Mira Sol Dr
- 3204 Fowler Rd
- 1506 Cavalier Ct
- 2000 Cardinal Dr
- 2417 Louise Ave
- 2824 Dale Ave
- 2841 Fowler Rd Unit 149
- 2720 Dale Ave
- 1542 Rose Ave
- 2640 Parkway
- 2845 E Hatch Rd Unit 87
- 3010 Roeding Rd
- 2816 10th St
- 2816 Canyon Dr
- 3524 Homestead Way Unit 57
- 3600 Homestead Way
- 2024 Garland Ct
- 2020 Garland Ct
- 2023 Loring Ct
- 2025 Loring Ct
- 2026 Garland Ct
- 2021 Loring Ct
- 2027 Loring Ct
- 2028 Garland Ct
- 2023 Garland Ct
- 2021 Garland Ct
- 2025 Garland Ct
- 2029 Loring Ct
- 2027 Garland Ct
- 2030 Garland Ct
- 2031 Loring Ct
- 2029 Garland Ct
- 2020 Loring Ct
- 2022 Loring Ct
- 2022 White Fall Ct
- 2024 Loring Ct