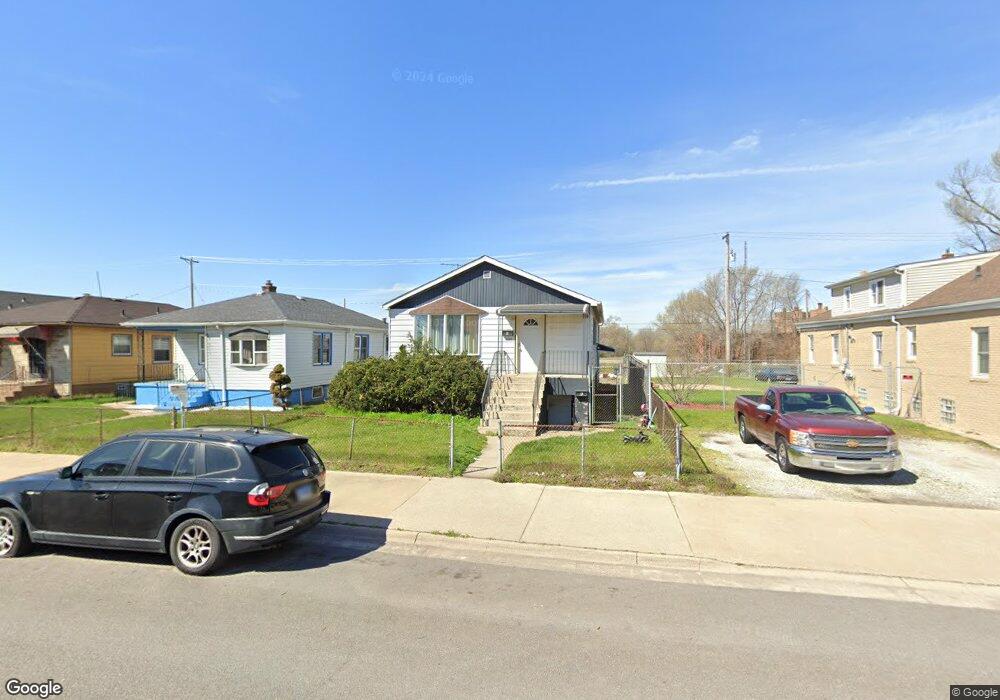
2022 Massachusetts St Gary, IN 46407
Midtown NeighborhoodEstimated Value: $64,000 - $184,000
4
Beds
2
Baths
1,025
Sq Ft
$102/Sq Ft
Est. Value
About This Home
This home is located at 2022 Massachusetts St, Gary, IN 46407 and is currently estimated at $104,154, approximately $101 per square foot. 2022 Massachusetts St is a home located in Lake County with nearby schools including Daniel Hale Williams Elementary School, Gary Middle School, and West Side Leadership Academy.
Ownership History
Date
Name
Owned For
Owner Type
Purchase Details
Closed on
Mar 18, 2020
Sold by
Follmann David M
Bought by
Dlab Llc
Current Estimated Value
Purchase Details
Closed on
Jan 14, 2020
Sold by
Felty Gerald
Bought by
Follmann David M
Purchase Details
Closed on
Jun 4, 2009
Sold by
U S Bank National Association
Bought by
Felty Gerald
Purchase Details
Closed on
Mar 6, 2009
Sold by
Hill Kenneth
Bought by
Wells Fargo Bank Na
Purchase Details
Closed on
Jan 29, 2009
Sold by
Wells Fargo Bank Na
Bought by
U S Bank National Association
Purchase Details
Closed on
Sep 26, 2005
Sold by
Black Diamond Urban Gems Llc
Bought by
Hill Kenneth
Home Financials for this Owner
Home Financials are based on the most recent Mortgage that was taken out on this home.
Original Mortgage
$58,500
Interest Rate
5.88%
Mortgage Type
Fannie Mae Freddie Mac
Create a Home Valuation Report for This Property
The Home Valuation Report is an in-depth analysis detailing your home's value as well as a comparison with similar homes in the area
Home Values in the Area
Average Home Value in this Area
Purchase History
| Date | Buyer | Sale Price | Title Company |
|---|---|---|---|
| Dlab Llc | -- | None Available | |
| Follmann David M | $3,000 | None Available | |
| Felty Gerald | -- | Meridian Title | |
| Wells Fargo Bank Na | $62,247 | None Available | |
| U S Bank National Association | -- | None Available | |
| Hill Kenneth | -- | Chicago Title Insurance Comp |
Source: Public Records
Mortgage History
| Date | Status | Borrower | Loan Amount |
|---|---|---|---|
| Previous Owner | Hill Kenneth | $58,500 |
Source: Public Records
Tax History Compared to Growth
Tax History
| Year | Tax Paid | Tax Assessment Tax Assessment Total Assessment is a certain percentage of the fair market value that is determined by local assessors to be the total taxable value of land and additions on the property. | Land | Improvement |
|---|---|---|---|---|
| 2024 | $3,844 | $45,800 | $6,500 | $39,300 |
| 2023 | $1,109 | $43,600 | $6,500 | $37,100 |
| 2022 | $1,109 | $43,300 | $3,300 | $40,000 |
| 2021 | $1,020 | $39,800 | $3,300 | $36,500 |
| 2020 | $1,020 | $39,800 | $3,300 | $36,500 |
| 2019 | $2,301 | $39,800 | $3,300 | $36,500 |
| 2018 | $2,310 | $49,900 | $4,100 | $45,800 |
| 2017 | $1,090 | $50,400 | $4,100 | $46,300 |
| 2016 | $1,121 | $52,600 | $4,100 | $48,500 |
| 2014 | $1,374 | $58,700 | $4,200 | $54,500 |
| 2013 | $1,301 | $57,900 | $4,200 | $53,700 |
Source: Public Records
Map
Nearby Homes
- 1971 Massachusetts St
- 1953 Connecticut St
- 400 E 20th Ave
- 2180 Nichols Place
- 1957 Madison Ln
- 1924 Virginia St
- 1745 Maryland St
- 1715 Maryland St
- 2259 Delaware St
- 2309 Connecticut St
- 2049 Monroe Ln
- 2290 Maryland St
- 1433 Pennsylvania St
- 555 W 22nd Place
- 1320 Delaware St
- 2344 Virginia St
- 724 W 19th Ave
- 1545 Van Buren St
- 2349 Virginia St
- 2420 Maryland St
- 2028 Massachusetts St
- 2012 Massachusetts St
- 2034 Massachusetts St
- 2010 Massachusetts St
- 2040 Massachusetts St
- 22 E 20th Place
- 1992 Massachusetts St
- 1990 Massachusetts St
- 1984 Massachusetts St
- 1980 Massachusetts St
- 2388 Broadway
- 1976 Massachusetts St
- 1985 Massachusetts St
- 2020 Connecticut St
- 2020 Connecticut St Unit 2
- 2020 Connecticut St Unit 1
- 2020 Connecticut St Unit 1
- 2020 Connecticut St Unit 2
- 1981-83 Broadway
- 2032 Connecticut St