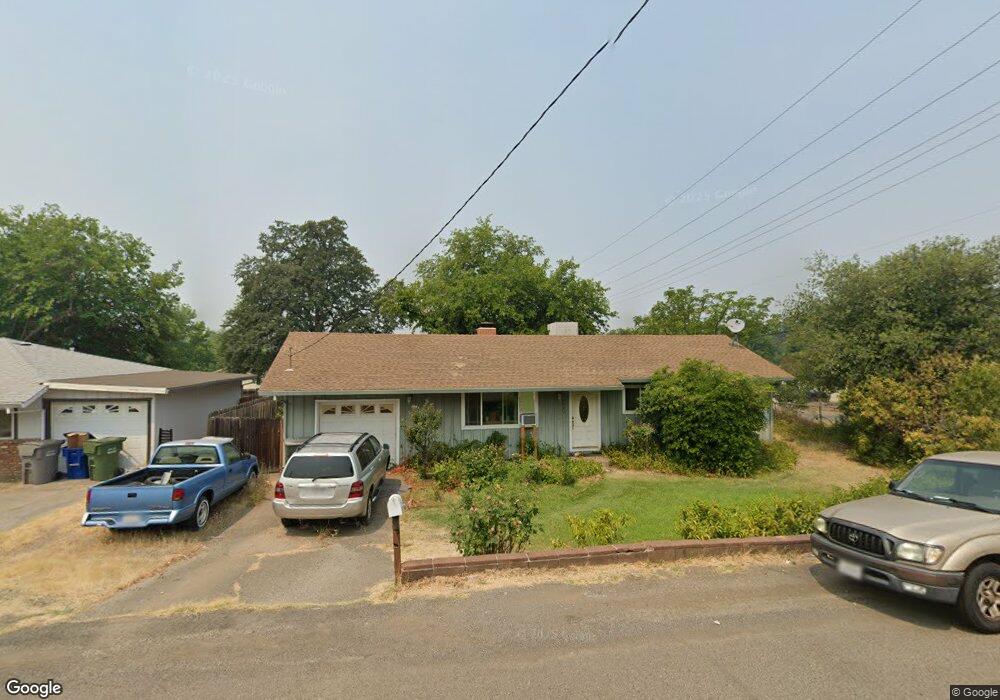
2022 Penn Dr Redding, CA 96002
Mistletoe NeighborhoodEstimated Value: $273,188 - $298,000
3
Beds
2
Baths
1,040
Sq Ft
$280/Sq Ft
Est. Value
About This Home
This home is located at 2022 Penn Dr, Redding, CA 96002 and is currently estimated at $291,297, approximately $280 per square foot. 2022 Penn Dr is a home located in Shasta County with nearby schools including Mistletoe Elementary School, Enterprise High School, and Montessori Children's House of Shady Oaks.
Ownership History
Date
Name
Owned For
Owner Type
Purchase Details
Closed on
Nov 6, 2001
Sold by
Hurst Fred and Hurst Frederick J
Bought by
Schirlls William J and Schirlls Jean E
Current Estimated Value
Home Financials for this Owner
Home Financials are based on the most recent Mortgage that was taken out on this home.
Original Mortgage
$102,583
Outstanding Balance
$39,799
Interest Rate
6.62%
Mortgage Type
FHA
Estimated Equity
$251,498
Purchase Details
Closed on
Jun 18, 1999
Sold by
Hurst Sheila D
Bought by
Hurst Frederick J
Home Financials for this Owner
Home Financials are based on the most recent Mortgage that was taken out on this home.
Original Mortgage
$60,150
Interest Rate
7.2%
Mortgage Type
Purchase Money Mortgage
Purchase Details
Closed on
Jun 17, 1999
Sold by
Hoisington Charles M and Hoisington Mary G
Bought by
Hurst Fred and Hurst Frederick J
Home Financials for this Owner
Home Financials are based on the most recent Mortgage that was taken out on this home.
Original Mortgage
$60,150
Interest Rate
7.2%
Mortgage Type
Purchase Money Mortgage
Create a Home Valuation Report for This Property
The Home Valuation Report is an in-depth analysis detailing your home's value as well as a comparison with similar homes in the area
Home Values in the Area
Average Home Value in this Area
Purchase History
| Date | Buyer | Sale Price | Title Company |
|---|---|---|---|
| Schirlls William J | $103,500 | Placer Title Company | |
| Hurst Frederick J | -- | -- | |
| Hurst Fred | $67,000 | Fidelity National Title Co |
Source: Public Records
Mortgage History
| Date | Status | Borrower | Loan Amount |
|---|---|---|---|
| Open | Schirlls William J | $102,583 | |
| Previous Owner | Hurst Fred | $60,150 |
Source: Public Records
Tax History
| Year | Tax Paid | Tax Assessment Tax Assessment Total Assessment is a certain percentage of the fair market value that is determined by local assessors to be the total taxable value of land and additions on the property. | Land | Improvement |
|---|---|---|---|---|
| 2025 | $1,681 | $152,874 | $35,439 | $117,435 |
| 2024 | $1,657 | $149,878 | $34,745 | $115,133 |
| 2023 | $1,657 | $146,940 | $34,064 | $112,876 |
| 2022 | $1,610 | $144,060 | $33,397 | $110,663 |
| 2021 | $1,555 | $141,237 | $32,743 | $108,494 |
| 2020 | $1,548 | $139,790 | $32,408 | $107,382 |
| 2019 | $1,536 | $137,050 | $31,773 | $105,277 |
| 2018 | $1,518 | $134,363 | $31,150 | $103,213 |
| 2017 | $1,545 | $131,730 | $30,540 | $101,190 |
| 2016 | $1,445 | $129,148 | $29,942 | $99,206 |
| 2015 | $1,434 | $127,209 | $29,493 | $97,716 |
| 2014 | $1,259 | $110,000 | $25,000 | $85,000 |
Source: Public Records
Map
Nearby Homes
- 1939 Cameo Ct
- 2093 Victor Ave
- 1701 E Cypress Ave
- 1556 Minor St
- 2820 Alfreda Way
- 1285 Lancers Ln
- 1110 Grouse Dr
- 1968 Bechelli Ln
- 1877 Wheeler St
- 2906 Regal Ave
- 1088 Burton Dr
- 0 Churn Creek Rd Unit 25-496
- 0 Churn Creek Rd Unit 26-609
- 0 Churn Creek Rd Unit 25-5491
- 918 Parsons Dr
- 2385 Shining Star Way
- 2295 Chelsa Cir
- 3178 Lawrence Rd
- 2115 Hawn Ave
- 550 Parsons Dr
- 2030 Penn Dr
- 1855 Mistletoe Ln
- 0 Mistletoe Ln
- 1345 Mistletoe Ln
- 2021 Penn Dr
- 2052 Penn Dr
- 1394 Mistletoe Ln
- 1412 Mistletoe Ln
- 1372 Mistletoe Ln
- 1335 Mistletoe Ln
- 2066 Penn Dr
- 2039 Penn Dr
- 1325 Mistletoe Ln
- 1407 Mistletoe Ln
- 1430 Mistletoe Ln
- 1350 Mistletoe Ln
- 2055 Penn Dr
- 1315 Mistletoe Ln
- 1448 Mistletoe Ln
- 2082 Penn Dr
Your Personal Tour Guide
Ask me questions while you tour the home.