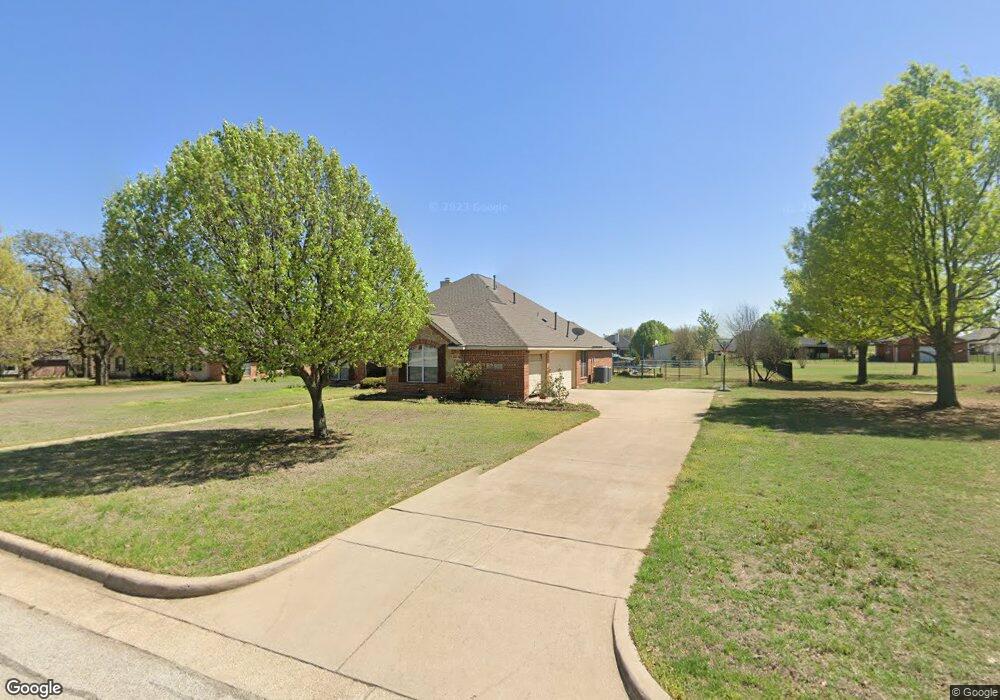
2022 Running Brook Dr Joshua, TX 76058
Estimated Value: $523,247 - $581,000
4
Beds
3
Baths
2,856
Sq Ft
$192/Sq Ft
Est. Value
About This Home
This home is located at 2022 Running Brook Dr, Joshua, TX 76058 and is currently estimated at $548,312, approximately $191 per square foot. 2022 Running Brook Dr is a home located in Johnson County with nearby schools including Plum Creek Elementary School, Joshua High School, and Joshua High School - 9th Grade Campus.
Ownership History
Date
Name
Owned For
Owner Type
Purchase Details
Closed on
Apr 28, 2017
Sold by
Rosebach Paul and Rosebach Jodi
Bought by
Watts Kenneth and Watts Tammy
Current Estimated Value
Home Financials for this Owner
Home Financials are based on the most recent Mortgage that was taken out on this home.
Original Mortgage
$313,500
Outstanding Balance
$262,131
Interest Rate
4.3%
Mortgage Type
New Conventional
Estimated Equity
$286,181
Purchase Details
Closed on
Oct 1, 2015
Sold by
Rosebach Jodi and Donely Jodi D
Bought by
Rosebach Paul and Rosebach Jodi
Purchase Details
Closed on
Apr 23, 2013
Sold by
Donley Jason
Bought by
Donley Jodi
Purchase Details
Closed on
Jun 13, 2007
Sold by
Tls Homes Inc
Bought by
Donley Jodi D
Home Financials for this Owner
Home Financials are based on the most recent Mortgage that was taken out on this home.
Original Mortgage
$207,900
Interest Rate
6.16%
Mortgage Type
New Conventional
Create a Home Valuation Report for This Property
The Home Valuation Report is an in-depth analysis detailing your home's value as well as a comparison with similar homes in the area
Home Values in the Area
Average Home Value in this Area
Purchase History
| Date | Buyer | Sale Price | Title Company |
|---|---|---|---|
| Watts Kenneth | -- | Providence Title Co | |
| Rosebach Paul | -- | Freedom Title Env | |
| Donley Jodi | -- | None Available | |
| Donley Jodi D | -- | Stnt |
Source: Public Records
Mortgage History
| Date | Status | Borrower | Loan Amount |
|---|---|---|---|
| Open | Watts Kenneth | $313,500 | |
| Previous Owner | Donley Jodi D | $207,900 |
Source: Public Records
Tax History Compared to Growth
Tax History
| Year | Tax Paid | Tax Assessment Tax Assessment Total Assessment is a certain percentage of the fair market value that is determined by local assessors to be the total taxable value of land and additions on the property. | Land | Improvement |
|---|---|---|---|---|
| 2025 | $8,883 | $535,977 | $36,000 | $499,977 |
| 2024 | $10,527 | $432,548 | $0 | $0 |
| 2023 | $7,357 | $440,717 | $36,000 | $404,717 |
| 2022 | $8,969 | $399,208 | $36,000 | $363,208 |
| 2021 | $8,227 | $347,322 | $36,000 | $311,322 |
| 2020 | $8,089 | $295,435 | $36,000 | $259,435 |
| 2019 | $8,499 | $295,435 | $36,000 | $259,435 |
| 2018 | $8,735 | $295,435 | $36,000 | $259,435 |
| 2017 | $8,117 | $274,680 | $36,000 | $238,680 |
| 2016 | $7,393 | $250,170 | $36,000 | $214,170 |
| 2015 | $6,513 | $250,170 | $36,000 | $214,170 |
| 2014 | $6,513 | $250,170 | $36,000 | $214,170 |
Source: Public Records
Map
Nearby Homes
- 2021 Running Brook Dr
- 2009 Running Brook Dr
- Scottsdale II Plan at Joshua Meadows
- Lexington SE Plan at Joshua Meadows
- Nottingham I Plan at Joshua Meadows
- Fairview SE Plan at Joshua Meadows
- Wildwood SE Plan at Joshua Meadows
- Henderson Plan at Joshua Meadows
- Kingswood Plan at Joshua Meadows
- Nottingham II Plan at Joshua Meadows
- Scottsdale I Plan at Joshua Meadows
- Bellaire SE Plan at Joshua Meadows
- Westwood SE Plan at Joshua Meadows
- El Dorado Plan at Joshua Meadows
- Ashwood Plan at Joshua Meadows
- 6013 Valley View Dr
- 3004 Valley View Dr
- 4025 Running Brook Dr
- 3012 Valley View Dr
- 5012 Pheasant Run Dr
- 3000 Running Brook Dr
- 2018 Running Brook Dr
- 3004 Running Brook Dr
- 3009 Big Springs Dr
- 2012 Running Brook Dr
- 3017 Big Springs Dr
- 2017 Running Brook Dr
- 3005 Big Springs Dr
- 2004 Running Brook Dr
- 3007 Running Brook Dr
- 2013 Running Brook Dr
- 3021 Big Springs Dr
- 3025 Big Springs Dr
- 3012 Running Brook Dr
- 3001 Big Springs Dr
- 3016 Big Springs Dr
- 3010 Big Springs Dr
- 2000 Running Brook Dr
- 3024 Big Springs Dr
- 3011 Running Brook Dr