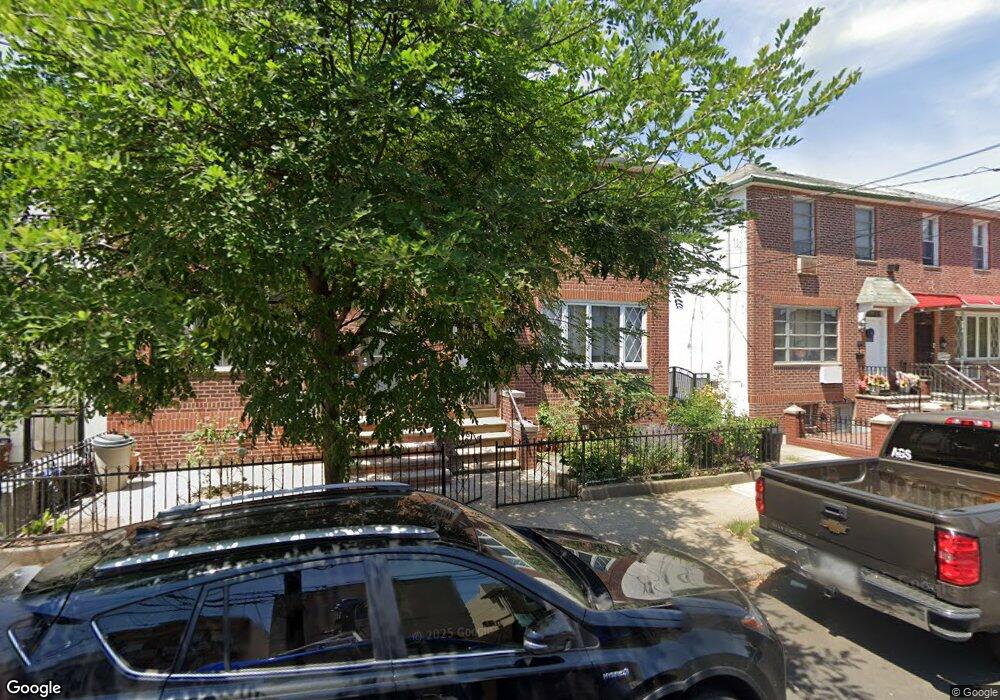
2022 W 7th St Brooklyn, NY 11223
Gravesend NeighborhoodEstimated Value: $872,055 - $1,122,000
--
Bed
--
Bath
1,596
Sq Ft
$641/Sq Ft
Est. Value
About This Home
This home is located at 2022 W 7th St, Brooklyn, NY 11223 and is currently estimated at $1,022,514, approximately $640 per square foot. 2022 W 7th St is a home located in Kings County with nearby schools including P.S. 95 - The Gravesend, Is 228 David A Boody, and Sts. Simon & Jude Elementary School.
Ownership History
Date
Name
Owned For
Owner Type
Purchase Details
Closed on
Jun 24, 1996
Sold by
Landolphi Donald F
Bought by
Leung Hok Keung and Tong Choi Har
Current Estimated Value
Home Financials for this Owner
Home Financials are based on the most recent Mortgage that was taken out on this home.
Original Mortgage
$110,000
Interest Rate
8.24%
Create a Home Valuation Report for This Property
The Home Valuation Report is an in-depth analysis detailing your home's value as well as a comparison with similar homes in the area
Home Values in the Area
Average Home Value in this Area
Purchase History
| Date | Buyer | Sale Price | Title Company |
|---|---|---|---|
| Leung Hok Keung | $175,000 | The Title Guarantee Company |
Source: Public Records
Mortgage History
| Date | Status | Borrower | Loan Amount |
|---|---|---|---|
| Previous Owner | Leung Hok Keung | $110,000 |
Source: Public Records
Tax History Compared to Growth
Tax History
| Year | Tax Paid | Tax Assessment Tax Assessment Total Assessment is a certain percentage of the fair market value that is determined by local assessors to be the total taxable value of land and additions on the property. | Land | Improvement |
|---|---|---|---|---|
| 2025 | $7,197 | $59,820 | $7,080 | $52,740 |
| 2024 | $7,197 | $55,500 | $7,080 | $48,420 |
| 2023 | $7,086 | $61,140 | $7,080 | $54,060 |
| 2022 | $6,571 | $66,960 | $7,080 | $59,880 |
| 2021 | $6,695 | $51,720 | $7,080 | $44,640 |
| 2020 | $5,021 | $53,340 | $7,080 | $46,260 |
| 2019 | $6,246 | $53,340 | $7,080 | $46,260 |
| 2018 | $5,927 | $29,077 | $3,842 | $25,235 |
| 2017 | $5,292 | $27,432 | $4,489 | $22,943 |
| 2016 | $4,990 | $26,512 | $4,560 | $21,952 |
| 2015 | $2,901 | $25,677 | $5,779 | $19,898 |
| 2014 | $2,901 | $24,883 | $6,721 | $18,162 |
Source: Public Records
Map
Nearby Homes