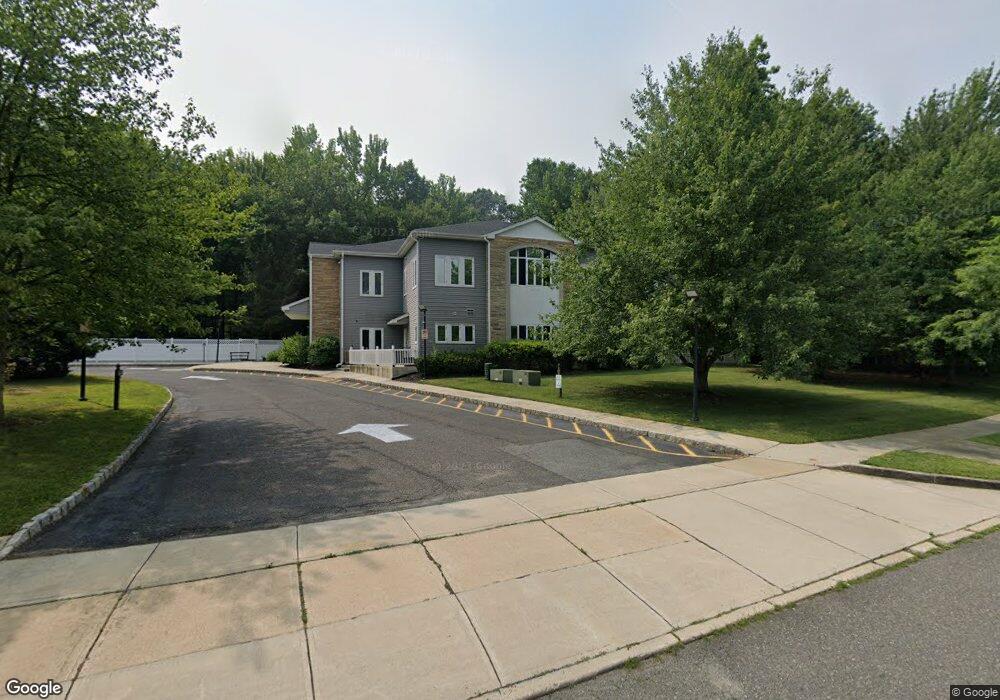
2022 Washington Blvd Trenton, NJ 08691
Estimated Value: $1,334,395
--
Bed
--
Bath
--
Sq Ft
3
Acres
About This Home
This home is located at 2022 Washington Blvd, Trenton, NJ 08691 and is currently estimated at $1,334,395. 2022 Washington Blvd is a home located in Mercer County with nearby schools including Sharon Elementary School, Pond Road Middle School, and Robbinsville High School.
Ownership History
Date
Name
Owned For
Owner Type
Purchase Details
Closed on
Aug 25, 2015
Sold by
Braghelli Nancy
Bought by
Aaa & A Llc
Current Estimated Value
Home Financials for this Owner
Home Financials are based on the most recent Mortgage that was taken out on this home.
Original Mortgage
$608,000
Outstanding Balance
$478,838
Interest Rate
4.07%
Mortgage Type
Commercial
Estimated Equity
$855,557
Purchase Details
Closed on
Jul 21, 2005
Sold by
Washington Dev Assoc
Bought by
Braghelli Nancy
Create a Home Valuation Report for This Property
The Home Valuation Report is an in-depth analysis detailing your home's value as well as a comparison with similar homes in the area
Home Values in the Area
Average Home Value in this Area
Purchase History
| Date | Buyer | Sale Price | Title Company |
|---|---|---|---|
| Aaa & A Llc | $760,000 | Group 21 Title Agency | |
| Braghelli Nancy | $2,100,000 | -- |
Source: Public Records
Mortgage History
| Date | Status | Borrower | Loan Amount |
|---|---|---|---|
| Open | Aaa & A Llc | $608,000 |
Source: Public Records
Tax History Compared to Growth
Tax History
| Year | Tax Paid | Tax Assessment Tax Assessment Total Assessment is a certain percentage of the fair market value that is determined by local assessors to be the total taxable value of land and additions on the property. | Land | Improvement |
|---|---|---|---|---|
| 2025 | $25,399 | $760,000 | $495,000 | $265,000 |
| 2024 | $23,704 | $760,000 | $495,000 | $265,000 |
| 2023 | $23,704 | $760,000 | $495,000 | $265,000 |
| 2022 | $22,785 | $760,000 | $495,000 | $265,000 |
| 2021 | $22,458 | $760,000 | $495,000 | $265,000 |
| 2020 | $22,466 | $760,000 | $495,000 | $265,000 |
| 2019 | $22,473 | $760,000 | $495,000 | $265,000 |
| 2018 | $22,329 | $760,000 | $495,000 | $265,000 |
| 2017 | $22,283 | $760,000 | $495,000 | $265,000 |
| 2016 | $22,078 | $760,000 | $495,000 | $265,000 |
| 2015 | $50,768 | $1,774,500 | $895,000 | $879,500 |
| 2014 | $50,946 | $1,774,500 | $895,000 | $879,500 |
Source: Public Records
Map
Nearby Homes