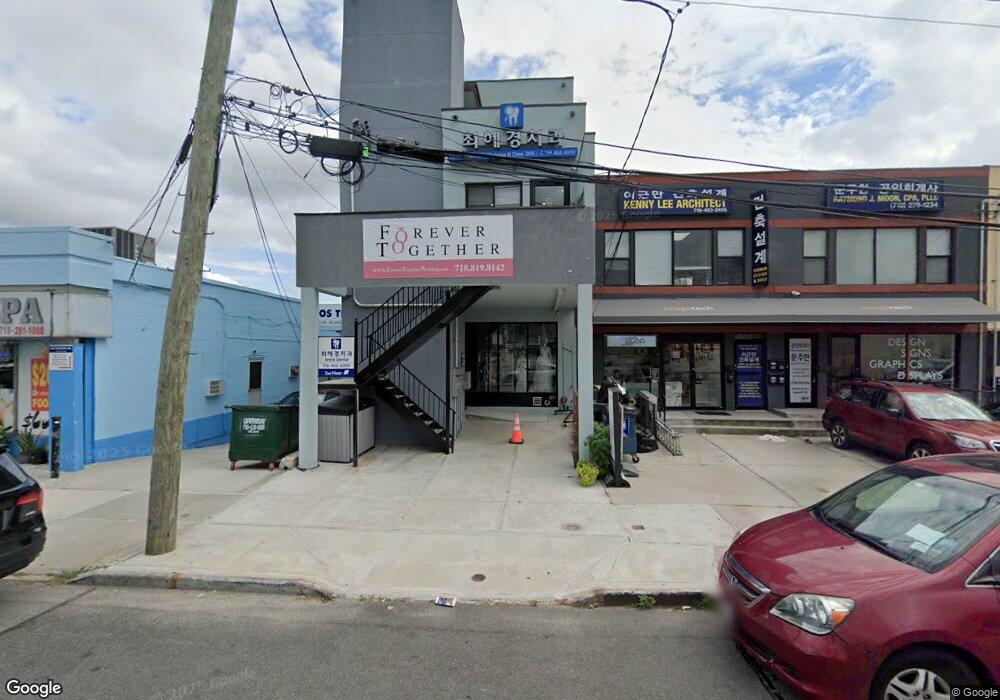
20220 45th Ave Flushing, NY 11361
Auburndale NeighborhoodEstimated Value: $943,514
Studio
--
Bath
3,228
Sq Ft
$292/Sq Ft
Est. Value
About This Home
This home is located at 20220 45th Ave, Flushing, NY 11361 and is currently estimated at $943,514, approximately $292 per square foot. 20220 45th Ave is a home located in Queens County with nearby schools including P.S. 162 The John Golden School, M.S. 158 - Marie Curie, and Francis Lewis High School.
Ownership History
Date
Name
Owned For
Owner Type
Purchase Details
Closed on
Jul 29, 2016
Sold by
Choi Do Hyun and Choi Young Ae
Bought by
202-20 Realty Corp
Current Estimated Value
Home Financials for this Owner
Home Financials are based on the most recent Mortgage that was taken out on this home.
Original Mortgage
$250,000
Outstanding Balance
$199,984
Interest Rate
3.56%
Mortgage Type
Commercial
Estimated Equity
$743,530
Purchase Details
Closed on
Feb 11, 2015
Sold by
Suk Mun Sang and Suk Yeung Ok
Bought by
Choi Do Hyun and Choi Young Ae
Purchase Details
Closed on
Mar 9, 2010
Sold by
Kim Young Soon and Suk Mun Sang
Bought by
Kim Young Soon
Purchase Details
Closed on
Sep 26, 2001
Sold by
Into Sports Inc
Bought by
Suk Mun Sang and Suk Yeung Ok
Home Financials for this Owner
Home Financials are based on the most recent Mortgage that was taken out on this home.
Original Mortgage
$220,000
Interest Rate
6.64%
Mortgage Type
Commercial
Create a Home Valuation Report for This Property
The Home Valuation Report is an in-depth analysis detailing your home's value as well as a comparison with similar homes in the area
Home Values in the Area
Average Home Value in this Area
Purchase History
| Date | Buyer | Sale Price | Title Company |
|---|---|---|---|
| 202-20 Realty Corp | $720,000 | -- | |
| Choi Do Hyun | $500,000 | -- | |
| Kim Young Soon | -- | -- | |
| Suk Mun Sang | -- | -- |
Source: Public Records
Mortgage History
| Date | Status | Borrower | Loan Amount |
|---|---|---|---|
| Open | 202-20 Realty Corp | $250,000 | |
| Previous Owner | Suk Mun Sang | $220,000 |
Source: Public Records
Tax History
| Year | Tax Paid | Tax Assessment Tax Assessment Total Assessment is a certain percentage of the fair market value that is determined by local assessors to be the total taxable value of land and additions on the property. | Land | Improvement |
|---|---|---|---|---|
| 2025 | $39,609 | $397,350 | $130,500 | $266,850 |
| 2024 | $30,306 | $373,950 | $112,680 | $261,270 |
| 2023 | $36,908 | $348,452 | $94,860 | $253,592 |
| 2022 | $23,267 | $378,000 | $130,500 | $247,500 |
| 2021 | $21,168 | $380,700 | $130,500 | $250,200 |
| 2020 | $19,716 | $202,500 | $41,400 | $161,100 |
| 2019 | $18,774 | $196,650 | $41,400 | $155,250 |
| 2018 | $17,790 | $169,200 | $41,400 | $127,800 |
| 2017 | $16,862 | $160,380 | $41,400 | $118,980 |
| 2016 | $16,254 | $160,380 | $41,400 | $118,980 |
| 2015 | $9,711 | $148,680 | $41,220 | $107,460 |
| 2014 | $9,711 | $145,260 | $40,680 | $104,580 |
Source: Public Records
Map
Nearby Homes
- 200-38 45th Ave
- 42-36 201st St
- 204-19 46th Rd
- 206-16 45th Rd
- 196-64 45th Ave
- 20410 42nd Ave
- 43-24 208th St
- 40-41 202nd St
- 206-38 45th Rd
- 206-41 46th Ave
- 206-50 46th Ave
- 47-02 Francis Lewis Blvd
- 207-04 42nd Ave
- 199-04 47th Ave
- 4005 203rd St
- 20206 Rocky Hill Rd Unit C1
- 45-66 196th Place
- 4734 206th St
- 4552 196th St
- 45-31 195th St
- 203-16 Northern Blvd
- 20316 Northern Blvd
- 202-28 45th Ave
- 4514 204th St
- 202-26 45th Ave
- 4503 204th St
- 202-20 45th Ave
- 20415 Northern Blvd
- 20231 45th Rd
- 202-31 45th Rd
- 4518 204th St
- 4518 204th St
- 20227 45th Rd
- 20315 Northern Blvd
- 20403 45th Rd
- 20218 45th Ave
- 20408 Northern Blvd
- 20223 45th Rd
- 204-03 45th Rd
- 202-16 45 Ave Unit 1Fl
Your Personal Tour Guide
Ask me questions while you tour the home.