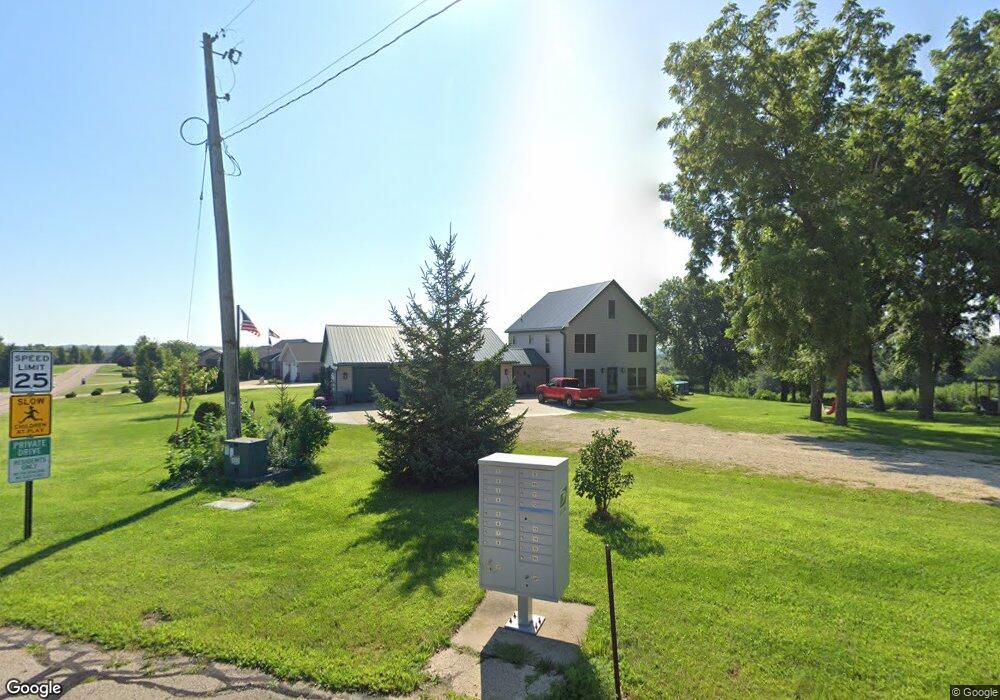
20220 Kruse Ln Sherrill, IA 52073
Estimated Value: $380,000 - $507,000
4
Beds
3
Baths
2,100
Sq Ft
$205/Sq Ft
Est. Value
About This Home
This home is located at 20220 Kruse Ln, Sherrill, IA 52073 and is currently estimated at $430,432, approximately $204 per square foot. 20220 Kruse Ln is a home located in Dubuque County with nearby schools including Sageville Elementary School, Thomas Jefferson Middle School, and Hempstead High School.
Ownership History
Date
Name
Owned For
Owner Type
Purchase Details
Closed on
Aug 19, 2020
Sold by
Riniker Thomas R and Riniker Rhonda R
Bought by
Lahey Edward Arthur and Lahey Megan Ranae
Current Estimated Value
Purchase Details
Closed on
Aug 23, 2010
Sold by
Rohner Jason and Rohner Jason M
Bought by
Lahey Edward A and Lahey Megan R
Home Financials for this Owner
Home Financials are based on the most recent Mortgage that was taken out on this home.
Original Mortgage
$155,300
Interest Rate
4.6%
Mortgage Type
New Conventional
Create a Home Valuation Report for This Property
The Home Valuation Report is an in-depth analysis detailing your home's value as well as a comparison with similar homes in the area
Home Values in the Area
Average Home Value in this Area
Purchase History
| Date | Buyer | Sale Price | Title Company |
|---|---|---|---|
| Lahey Edward Arthur | -- | None Available | |
| Lahey Edward A | $163,500 | None Available |
Source: Public Records
Mortgage History
| Date | Status | Borrower | Loan Amount |
|---|---|---|---|
| Previous Owner | Lahey Edward A | $155,300 |
Source: Public Records
Tax History Compared to Growth
Tax History
| Year | Tax Paid | Tax Assessment Tax Assessment Total Assessment is a certain percentage of the fair market value that is determined by local assessors to be the total taxable value of land and additions on the property. | Land | Improvement |
|---|---|---|---|---|
| 2025 | $3,318 | $330,800 | $73,700 | $257,100 |
| 2024 | $3,318 | $293,900 | $70,200 | $223,700 |
| 2023 | $3,204 | $293,900 | $70,200 | $223,700 |
| 2022 | $3,042 | $233,640 | $65,000 | $168,640 |
| 2021 | $3,042 | $233,640 | $65,000 | $168,640 |
| 2020 | $3,186 | $228,610 | $62,000 | $166,610 |
| 2019 | $2,818 | $228,610 | $62,000 | $166,610 |
| 2018 | $2,746 | $195,450 | $48,000 | $147,450 |
| 2017 | $2,796 | $195,450 | $48,000 | $147,450 |
| 2016 | $2,796 | $180,920 | $45,000 | $135,920 |
| 2015 | $2,720 | $180,920 | $45,000 | $135,920 |
| 2014 | $2,516 | $173,380 | $42,500 | $130,880 |
Source: Public Records
Map
Nearby Homes
- 20216 Kruse Ln
- LOT 26 Gretchen Ct
- LOT 25 Gretchen Ct
- Lot 5 Red Wing Dr
- Lot 1 Koltes Ln
- 0 Kane Unit 151271
- Lot 6 Heritage Ridge Estates Unit San Sebastian Drive
- Lot 18 San Sebastian Dr
- Lot 19 Emerald Dr
- Lot 2 Lismore Ln
- 17325 Dayflower St
- 12169 Timber Ct
- 12088 Timber Ct
- Lot 91 Lasso Ct
- Lot 90 Lasso Ct
- Lot 94 Lasso Ct
- Lot 92 Lasso Ct
- Lot 93 Lasso Ct
- 3676 Vintage Ln
- 3669 Vintage Ln
- 20254 Kruse Ln
- L2 Kruse Ln Sleepy Hollow Ln
- 20243 Kruse Ln
- 20266 Kruse Ln
- 20146 Kruse Ln
- 20259 Kruse Ln
- 20280 Kruse Ln
- 20144 Kruse Ln
- 20275 Kruse Ln
- 20300 Kruse Ln
- 20094 Kruse Ln
- 20320 Kruse Ln
- 20092 Kruse Ln
- 20299 Kruse Ln
- Lot 5 Kruse Ln Unit Sleepy Hollow Estate
- Lot 6 Kruse Ln Unit Sleepy Hollow Estate
- 0 Kruse Ln Unit 118142
- 20315 Kruse Ln
- 19858 Kruse Ln
- 20340 Kruse Ln