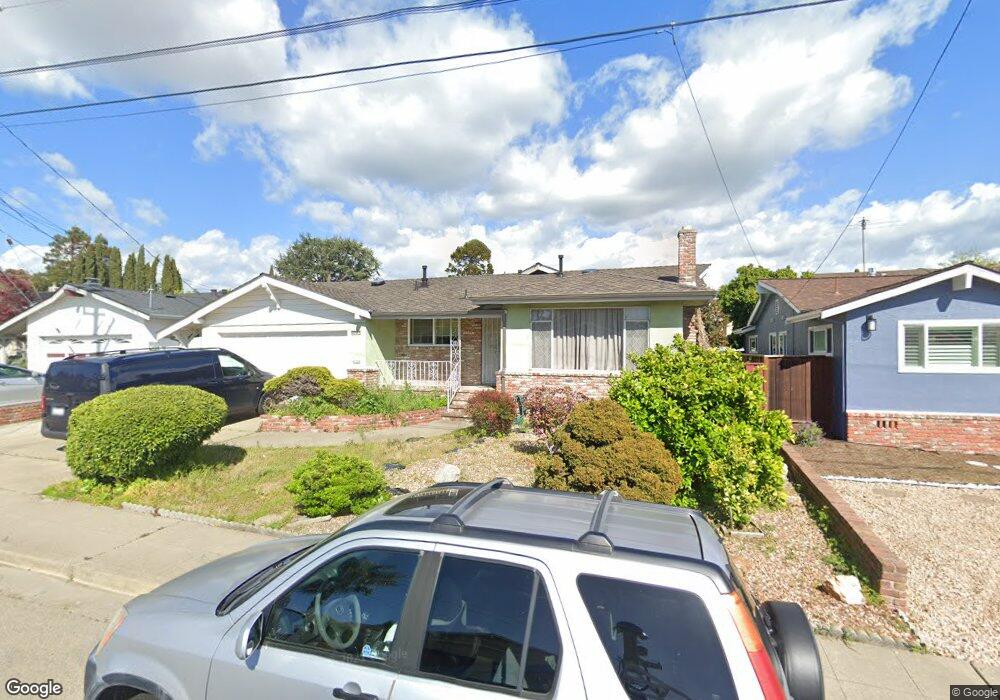
20226 Meadowlark Dr Castro Valley, CA 94546
Castro Valley East NeighborhoodEstimated Value: $1,075,000 - $1,133,000
3
Beds
2
Baths
1,599
Sq Ft
$689/Sq Ft
Est. Value
About This Home
This home is located at 20226 Meadowlark Dr, Castro Valley, CA 94546 and is currently estimated at $1,101,985, approximately $689 per square foot. 20226 Meadowlark Dr is a home located in Alameda County with nearby schools including Marshall Elementary School, Creekside Middle School, and Canyon Middle School.
Ownership History
Date
Name
Owned For
Owner Type
Purchase Details
Closed on
Apr 15, 2010
Sold by
Escobar Hermann and Caro Andres
Bought by
Guan Run Rong and Yang Sheryl Cai Xia
Current Estimated Value
Home Financials for this Owner
Home Financials are based on the most recent Mortgage that was taken out on this home.
Original Mortgage
$344,000
Outstanding Balance
$228,206
Interest Rate
4.92%
Mortgage Type
New Conventional
Estimated Equity
$873,779
Purchase Details
Closed on
Dec 21, 2005
Sold by
Dellacqua Richard Reno and Inez Dell Acqua 1995 Trust
Bought by
Escobar Hermann and Caro Andres
Home Financials for this Owner
Home Financials are based on the most recent Mortgage that was taken out on this home.
Original Mortgage
$130,000
Interest Rate
6.36%
Mortgage Type
Stand Alone Second
Purchase Details
Closed on
Feb 3, 1995
Sold by
Dellacqua Inez
Bought by
Dellacqua Inez and The Inez Dellacqua 1995 Trust
Create a Home Valuation Report for This Property
The Home Valuation Report is an in-depth analysis detailing your home's value as well as a comparison with similar homes in the area
Home Values in the Area
Average Home Value in this Area
Purchase History
| Date | Buyer | Sale Price | Title Company |
|---|---|---|---|
| Guan Run Rong | $430,000 | Security Union Title Ins Co | |
| Escobar Hermann | $650,000 | -- | |
| Dellacqua Inez | -- | -- |
Source: Public Records
Mortgage History
| Date | Status | Borrower | Loan Amount |
|---|---|---|---|
| Open | Guan Run Rong | $344,000 | |
| Previous Owner | Escobar Hermann | $130,000 |
Source: Public Records
Tax History Compared to Growth
Tax History
| Year | Tax Paid | Tax Assessment Tax Assessment Total Assessment is a certain percentage of the fair market value that is determined by local assessors to be the total taxable value of land and additions on the property. | Land | Improvement |
|---|---|---|---|---|
| 2025 | $7,168 | $548,013 | $166,504 | $388,509 |
| 2024 | $7,168 | $537,134 | $163,240 | $380,894 |
| 2023 | $7,045 | $533,465 | $160,039 | $373,426 |
| 2022 | $6,903 | $516,008 | $156,902 | $366,106 |
| 2021 | $6,724 | $505,757 | $153,827 | $358,930 |
| 2020 | $6,569 | $507,502 | $152,250 | $355,252 |
| 2019 | $6,685 | $497,552 | $149,265 | $348,287 |
| 2018 | $6,495 | $487,800 | $146,340 | $341,460 |
| 2017 | $6,323 | $478,237 | $143,471 | $334,766 |
| 2016 | $6,016 | $468,863 | $140,659 | $328,204 |
| 2015 | $5,622 | $461,824 | $138,547 | $323,277 |
| 2014 | $5,549 | $452,780 | $135,834 | $316,946 |
Source: Public Records
Map
Nearby Homes
- 3767 Castro Valley Blvd
- 19901 Forest Ave
- 3769 Castro Valley Blvd
- 3775 Castro Valley Blvd
- 3824 Norbridge Ave
- 3710 Scribe Way
- Plan 1714 at The Chapter
- Plan 1582 at The Chapter
- Plan 1660 at The Chapter
- Plan 1606 at The Chapter
- Plan 1495 at The Chapter
- Plan 1705 at The Chapter
- Plan 1423 Modeled at The Chapter
- Plan 1749 Modeled at The Chapter
- 21061 Story St
- 3826 Norbridge Ave
- 3838 Norbridge Ave
- 3913 Castro Valley Blvd Unit 39
- 3998 Castro Valley Blvd Unit 34
- 3998 Castro Valley Blvd Unit SPC 27
- 20212 Meadowlark Dr
- 20240 Meadowlark Dr
- 3987 Clara Lee Ln
- 3983 Clara Lee Ln
- 3991 Clara Lee Ln
- 3979 Clara Lee Ln
- 20254 Meadowlark Dr
- 20198 Meadowlark Dr
- 20228 Yeandle Ave
- 3975 Clara Lee Ln
- 20239 Meadowlark Dr
- 20227 Yeandle Ave
- 3982 Clara Lee Ln
- 3988 Clara Lee Ln
- 20268 Meadowlark Dr
- 3976 Clara Lee Ln
- 20253 Meadowlark Dr
- 20183 Meadowlark Dr
- 20170 Meadowlark Dr
- 20327 Forest Ave