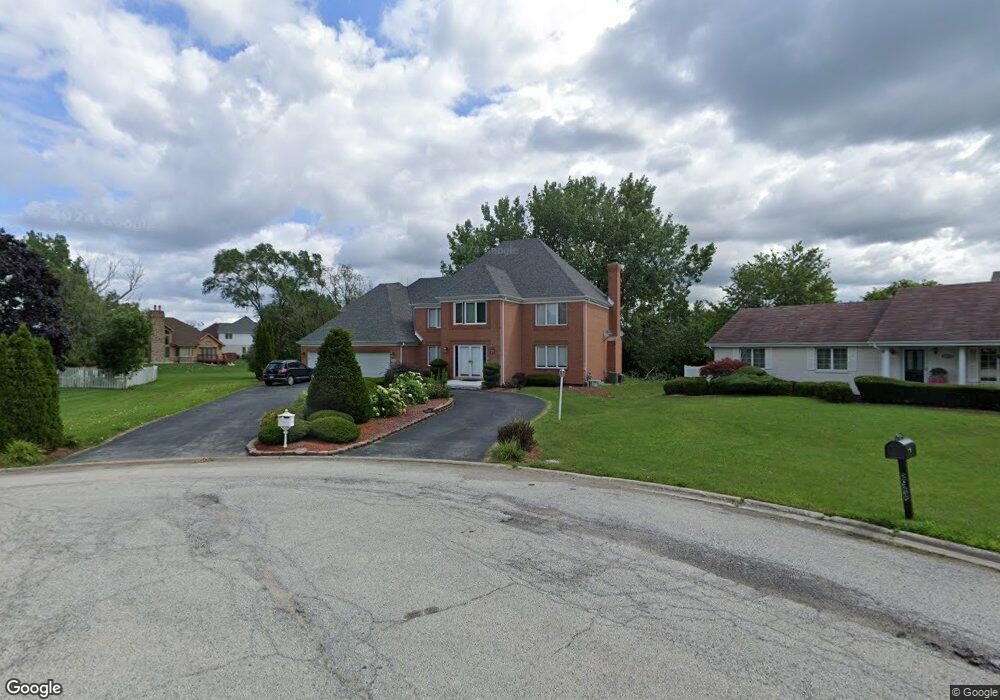
20229 Wilderness Trail Olympia Fields, IL 60461
Estimated Value: $482,790 - $510,000
4
Beds
3
Baths
3,784
Sq Ft
$132/Sq Ft
Est. Value
About This Home
This home is located at 20229 Wilderness Trail, Olympia Fields, IL 60461 and is currently estimated at $497,698, approximately $131 per square foot. 20229 Wilderness Trail is a home located in Cook County with nearby schools including Illinois School, Arcadia Elementary School, and Indiana Elementary School.
Ownership History
Date
Name
Owned For
Owner Type
Purchase Details
Closed on
Nov 2, 2018
Sold by
Walker Wesley and Jordan Walker Deniece C
Bought by
Jordan Walker Deniece C
Current Estimated Value
Home Financials for this Owner
Home Financials are based on the most recent Mortgage that was taken out on this home.
Original Mortgage
$175,541
Outstanding Balance
$152,823
Interest Rate
4.8%
Mortgage Type
New Conventional
Estimated Equity
$344,875
Purchase Details
Closed on
Apr 29, 1994
Sold by
Walker Wesley and Jordan Walker Deneice
Bought by
Walker Wesley and Jordan Walker Deneice
Purchase Details
Closed on
Feb 23, 1994
Sold by
Nlsb
Bought by
Walker Wesley and Jordan Walker Deneice
Home Financials for this Owner
Home Financials are based on the most recent Mortgage that was taken out on this home.
Original Mortgage
$285,000
Interest Rate
7.04%
Create a Home Valuation Report for This Property
The Home Valuation Report is an in-depth analysis detailing your home's value as well as a comparison with similar homes in the area
Home Values in the Area
Average Home Value in this Area
Purchase History
| Date | Buyer | Sale Price | Title Company |
|---|---|---|---|
| Jordan Walker Deniece C | -- | None Available | |
| Walker Wesley | -- | -- | |
| Walker Wesley | -- | -- |
Source: Public Records
Mortgage History
| Date | Status | Borrower | Loan Amount |
|---|---|---|---|
| Open | Jordan Walker Deniece C | $175,541 | |
| Previous Owner | Walker Wesley | $285,000 |
Source: Public Records
Tax History
| Year | Tax Paid | Tax Assessment Tax Assessment Total Assessment is a certain percentage of the fair market value that is determined by local assessors to be the total taxable value of land and additions on the property. | Land | Improvement |
|---|---|---|---|---|
| 2025 | $15,244 | $41,000 | $10,029 | $30,971 |
| 2024 | $15,244 | $41,000 | $10,029 | $30,971 |
| 2023 | $19,931 | $41,000 | $10,029 | $30,971 |
| 2022 | $19,931 | $38,515 | $8,915 | $29,600 |
| 2021 | $19,829 | $38,514 | $8,914 | $29,600 |
| 2020 | $18,243 | $38,514 | $8,914 | $29,600 |
| 2019 | $18,982 | $39,653 | $8,357 | $31,296 |
| 2018 | $18,845 | $39,653 | $8,357 | $31,296 |
| 2017 | $18,248 | $39,653 | $8,357 | $31,296 |
| 2016 | $13,570 | $29,520 | $7,800 | $21,720 |
| 2015 | $14,773 | $32,136 | $7,800 | $24,336 |
| 2014 | $14,466 | $32,136 | $7,800 | $24,336 |
| 2013 | $13,302 | $32,434 | $7,800 | $24,634 |
Source: Public Records
Map
Nearby Homes
- 20015 Delphi Dr
- 3451 Ithaca Rd
- 2904 Athena Ct
- 2908 Athena Ct
- 3506 Ithaca Rd
- 3415 Vollmer Rd Unit 308
- 20415 Doria Ln
- 1816 Quail Ct
- 20436 Arcadian Dr
- 3427 Vollmer Rd Unit 205
- 3427 Vollmer Rd Unit 202
- 3427 Vollmer Rd Unit 209
- 3507 Park Place
- 20535 Marathon Ct
- 2935 Dartmouth Ln
- 2925 Dartmouth Ln
- 2937 Kathleen Ln
- 20601 Parthenon Way
- 20001 Arquilla Cir
- 1741 Oak Lane Rd
- 20235 Wilderness Trail
- 13864 Wilderness Trail
- 20228 Wilderness Trail
- 3212 Hudson Trail
- 3207 Cumberland Trail
- 3201 Cumberland Trail
- 20234 Wilderness Trail
- 3218 Hudson Trail
- 20240 Wilderness Trail
- 3206 Hudson Trail
- 3225 Cumberland Trail
- 20135 Mohawk Trail
- 3211 Hudson Trail
- 3211 Hudson Trail
- 3211 Hudson Trail
- 20129 Mohawk Trail
- 20205 Mohawk Trail
- 3231 Cumberland Trail
- 3206 Cumberland Trail
- 20211 Mohawk Trail
Your Personal Tour Guide
Ask me questions while you tour the home.