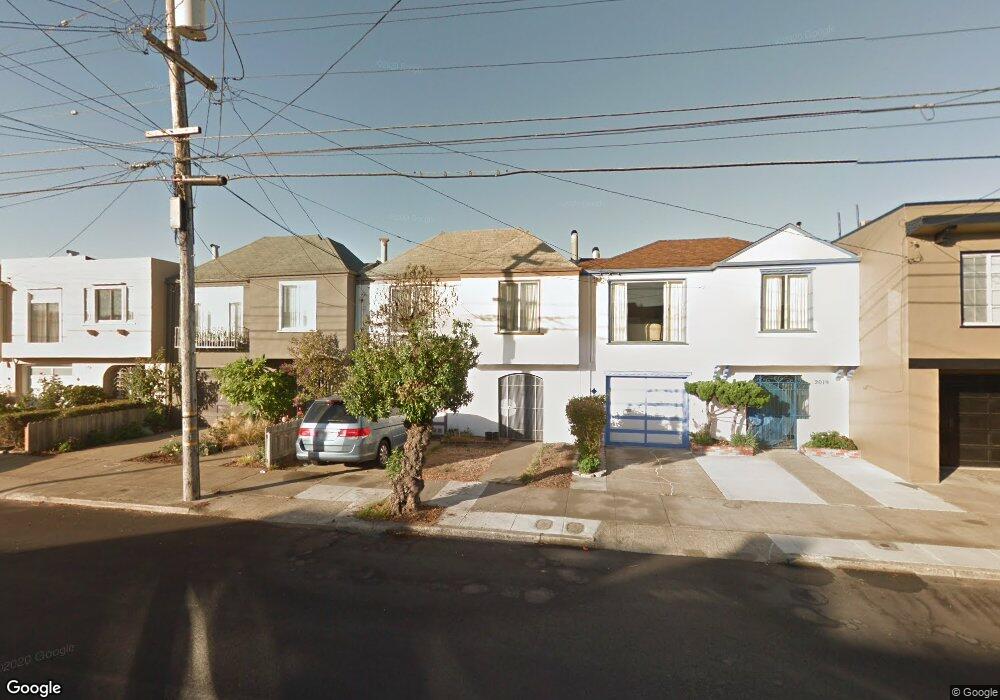
2023 45th Ave San Francisco, CA 94116
Outer Parkside NeighborhoodEstimated Value: $1,239,000 - $1,662,513
4
Beds
3
Baths
1,440
Sq Ft
$1,006/Sq Ft
Est. Value
About This Home
This home is located at 2023 45th Ave, San Francisco, CA 94116 and is currently estimated at $1,448,628, approximately $1,005 per square foot. 2023 45th Ave is a home located in San Francisco County with nearby schools including Sunset Elementary School, Giannini (A.P.) Middle School, and Holy Name Elementary School.
Ownership History
Date
Name
Owned For
Owner Type
Purchase Details
Closed on
Dec 19, 2006
Sold by
Choy William See Yuen and Choy Andy See Wai
Bought by
Choy Shuen Chun and Choy Susana Sau King
Current Estimated Value
Purchase Details
Closed on
Apr 19, 2000
Sold by
Chun Choy Shuen
Bought by
The Sf & Sj Holding Trust
Create a Home Valuation Report for This Property
The Home Valuation Report is an in-depth analysis detailing your home's value as well as a comparison with similar homes in the area
Home Values in the Area
Average Home Value in this Area
Purchase History
We collect this data history from publicly available records. To have your information removed, we recommend requesting removal directly through your county’s website.
| Date | Buyer | Sale Price | Title Company |
|---|---|---|---|
| Choy Shuen Chun | -- | None Available | |
| The Sf & Sj Holding Trust | -- | -- |
Source: Public Records
Tax History
| Year | Tax Paid | Tax Assessment Tax Assessment Total Assessment is a certain percentage of the fair market value that is determined by local assessors to be the total taxable value of land and additions on the property. | Land | Improvement |
|---|---|---|---|---|
| 2025 | $2,584 | $146,929 | $56,570 | $90,359 |
| 2024 | $2,584 | $144,049 | $55,461 | $88,588 |
| 2023 | $2,489 | $141,226 | $54,374 | $86,852 |
| 2022 | $2,418 | $138,458 | $53,308 | $85,150 |
| 2021 | $2,371 | $135,745 | $52,263 | $83,482 |
| 2020 | $2,452 | $134,355 | $51,728 | $82,627 |
| 2019 | $2,327 | $131,721 | $50,714 | $81,007 |
| 2018 | $2,252 | $129,139 | $49,720 | $79,419 |
| 2017 | $1,928 | $126,609 | $48,746 | $77,863 |
| 2016 | $1,868 | $124,129 | $47,791 | $76,338 |
| 2015 | $1,843 | $122,267 | $47,074 | $75,193 |
| 2014 | $1,798 | $119,873 | $46,152 | $73,721 |
Source: Public Records
Map
Nearby Homes
Your Personal Tour Guide
Ask me questions while you tour the home.