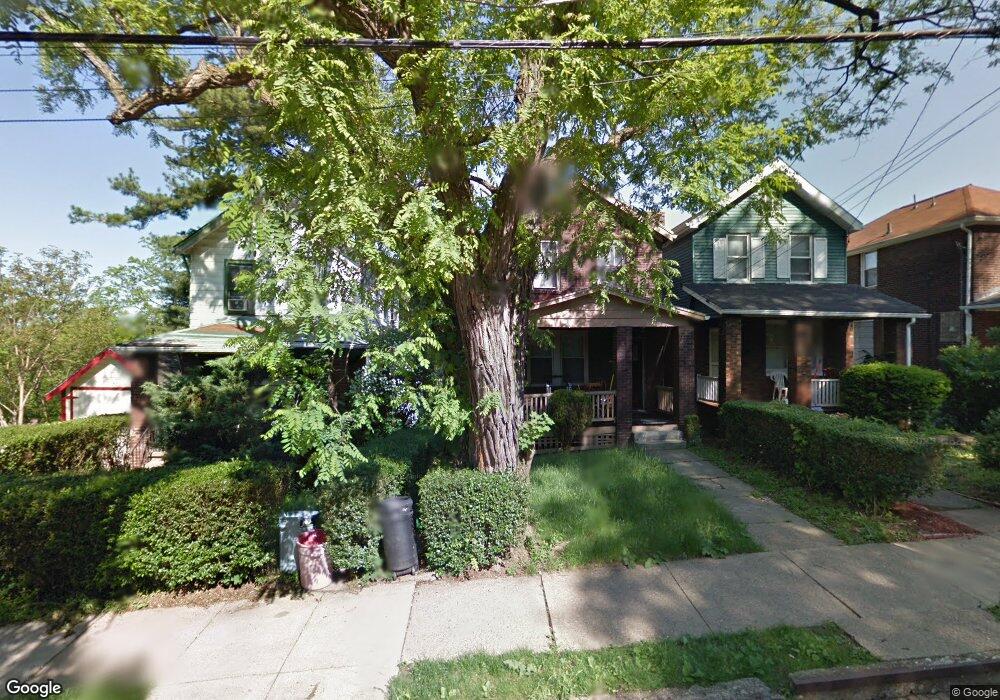
2023 Chalfant St Pittsburgh, PA 15221
Estimated Value: $73,000 - $98,000
2
Beds
1
Bath
944
Sq Ft
$93/Sq Ft
Est. Value
About This Home
This home is located at 2023 Chalfant St, Pittsburgh, PA 15221 and is currently estimated at $87,633, approximately $92 per square foot. 2023 Chalfant St is a home located in Allegheny County with nearby schools including Imani Christian Academy and Pittsburgh Urban Christian School.
Ownership History
Date
Name
Owned For
Owner Type
Purchase Details
Closed on
Jan 8, 2024
Sold by
Monroe Living L L C
Bought by
Foulks Jamar K and Mccoy Sarrina M
Current Estimated Value
Home Financials for this Owner
Home Financials are based on the most recent Mortgage that was taken out on this home.
Original Mortgage
$73,641
Outstanding Balance
$72,433
Interest Rate
7.29%
Mortgage Type
New Conventional
Estimated Equity
$15,200
Purchase Details
Closed on
Jan 5, 2024
Sold by
Monroe Living Llc
Bought by
Foulks Jamar K
Home Financials for this Owner
Home Financials are based on the most recent Mortgage that was taken out on this home.
Original Mortgage
$73,641
Outstanding Balance
$72,433
Interest Rate
7.29%
Mortgage Type
New Conventional
Estimated Equity
$15,200
Purchase Details
Closed on
Mar 20, 2020
Sold by
Monroe Alan
Bought by
Monroe Living Llc
Purchase Details
Closed on
Jan 19, 2018
Sold by
Davis Le Andre
Bought by
Monroe Alan
Purchase Details
Closed on
Jul 14, 2011
Sold by
Childrens Christian Home Dayca
Bought by
Davis Le Andre
Purchase Details
Closed on
Mar 2, 2006
Sold by
Ridgely Michele E
Bought by
Childrens Christian Hm Daycare
Create a Home Valuation Report for This Property
The Home Valuation Report is an in-depth analysis detailing your home's value as well as a comparison with similar homes in the area
Home Values in the Area
Average Home Value in this Area
Purchase History
| Date | Buyer | Sale Price | Title Company |
|---|---|---|---|
| Foulks Jamar K | $75,000 | -- | |
| Foulks Jamar K | $75,000 | -- | |
| Monroe Living Llc | -- | Attorney | |
| Monroe Alan | -- | None Available | |
| Davis Le Andre | $10,000 | -- | |
| Childrens Christian Hm Daycare | $19,000 | -- |
Source: Public Records
Mortgage History
| Date | Status | Borrower | Loan Amount |
|---|---|---|---|
| Open | Foulks Jamar K | $73,641 |
Source: Public Records
Tax History Compared to Growth
Tax History
| Year | Tax Paid | Tax Assessment Tax Assessment Total Assessment is a certain percentage of the fair market value that is determined by local assessors to be the total taxable value of land and additions on the property. | Land | Improvement |
|---|---|---|---|---|
| 2025 | $648 | $40,900 | $8,200 | $32,700 |
| 2024 | $648 | $15,000 | $2,600 | $12,400 |
| 2023 | $648 | $15,000 | $2,600 | $12,400 |
| 2022 | $678 | $15,000 | $2,600 | $12,400 |
| 2021 | $678 | $15,000 | $2,600 | $12,400 |
| 2020 | $723 | $15,000 | $2,600 | $12,400 |
| 2019 | $723 | $15,000 | $2,600 | $12,400 |
| 2018 | $71 | $15,000 | $2,600 | $12,400 |
| 2017 | $770 | $15,000 | $2,600 | $12,400 |
| 2016 | $71 | $15,000 | $2,600 | $12,400 |
| 2015 | $71 | $15,000 | $2,600 | $12,400 |
| 2014 | $770 | $15,000 | $2,600 | $12,400 |
Source: Public Records
Map
Nearby Homes
- 1938 Laketon Rd
- 2050 Laketon Rd
- 2070 Boggs Ave
- 2165 Lindsay Rd
- 1541 Graham Blvd
- 1769-1779 Mcnary Blvd
- 2233 Laketon Rd
- 2241 Laketon Rd
- 1910 Beech St
- 2315 Mcnary Blvd
- 1525 Collins Rd
- 2027 William Penn Hwy
- 2318 Collins Rd
- 1730 Graham Blvd
- 1931 Remington Dr
- 1817 Montier St
- 2200 William Penn Hwy
- 1629 Laketon Rd
- 2381 Collins Rd
- 2020 Frankella Ave
- 2021 Chalfant St
- 2027 Chalfant St
- 2029 Chalfant St
- 2015 Chalfant St
- 2031 Chalfant St
- 2035 Chalfant St
- 2011 Chalfant St
- 2039 Chalfant St
- 2009 Chalfant St
- 1942 Laketon Rd
- 2041 Chalfant St
- 1940 Laketon Rd
- 2024 Chalfant St
- 2005 Chalfant St
- 2004 Laketon Rd
- 2000 Laketon Rd
- 2028 Chalfant St
- 2016 Chalfant St
- 2043 Chalfant St
- 2032 Chalfant St