Estimated Value: $314,000 - $393,000
3
Beds
3
Baths
3,125
Sq Ft
$110/Sq Ft
Est. Value
About This Home
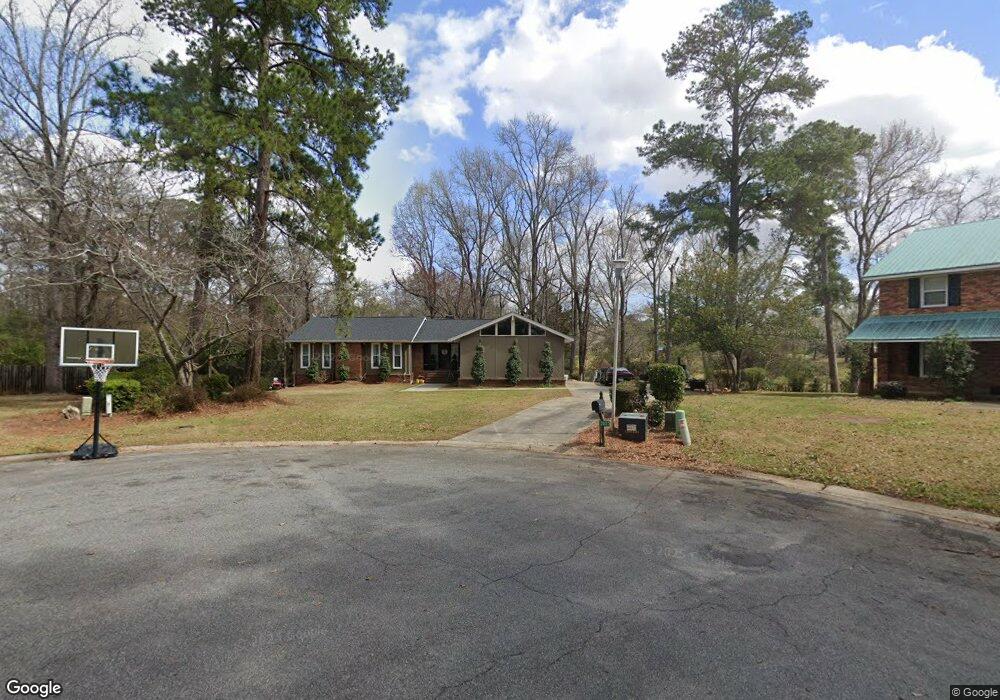
This home is located at 2023 Laurel Dr, Perry, GA 31069 and is currently estimated at $343,491, approximately $109 per square foot. 2023 Laurel Dr is a home located in Houston County with nearby schools including Morningside Elementary School, Perry Middle School, and Perry High School.
Ownership History
Date
Name
Owned For
Owner Type
Purchase Details
Closed on
Mar 21, 2016
Sold by
Crumpton Georganne K
Bought by
Mcintyre Brandi B
Current Estimated Value
Home Financials for this Owner
Home Financials are based on the most recent Mortgage that was taken out on this home.
Original Mortgage
$173,302
Outstanding Balance
$135,278
Interest Rate
3.65%
Mortgage Type
FHA
Estimated Equity
$208,213
Purchase Details
Closed on
Jun 24, 2015
Sold by
Kirk Patricia M
Bought by
Crumpton Georganne K
Purchase Details
Closed on
Aug 30, 1985
Sold by
500 Inc & Culpepper Charles F
Bought by
Kirk Patricia M
Purchase Details
Closed on
Aug 19, 1985
Sold by
Crumpton Georganne Kirk and Kirk Charles C
Bought by
Kirk Patricia M
Purchase Details
Closed on
Oct 8, 1983
Sold by
Kirk George A Estate
Bought by
Kirk Patricia M
Purchase Details
Closed on
Mar 17, 1983
Sold by
Culpepper Charles F
Bought by
Kirk George A and Patricia M*
Purchase Details
Closed on
Sep 15, 1982
Sold by
500 Inc
Bought by
Culpepper Charles F
Create a Home Valuation Report for This Property
The Home Valuation Report is an in-depth analysis detailing your home's value as well as a comparison with similar homes in the area
Home Values in the Area
Average Home Value in this Area
Purchase History
| Date | Buyer | Sale Price | Title Company |
|---|---|---|---|
| Mcintyre Brandi B | $176,500 | -- | |
| Crumpton Georganne K | -- | -- | |
| Kirk Patricia M | -- | -- | |
| Kirk Patricia M | -- | -- | |
| Kirk Patricia M | -- | -- | |
| Kirk George A | -- | -- | |
| Culpepper Charles F | -- | -- |
Source: Public Records
Mortgage History
| Date | Status | Borrower | Loan Amount |
|---|---|---|---|
| Open | Mcintyre Brandi B | $173,302 |
Source: Public Records
Tax History
| Year | Tax Paid | Tax Assessment Tax Assessment Total Assessment is a certain percentage of the fair market value that is determined by local assessors to be the total taxable value of land and additions on the property. | Land | Improvement |
|---|---|---|---|---|
| 2025 | $3,158 | $96,080 | $12,000 | $84,080 |
| 2024 | $3,316 | $90,240 | $9,760 | $80,480 |
| 2023 | $2,789 | $75,400 | $9,760 | $65,640 |
| 2022 | $1,642 | $71,400 | $9,760 | $61,640 |
| 2021 | $1,516 | $65,560 | $9,760 | $55,800 |
| 2020 | $1,436 | $61,800 | $9,760 | $52,040 |
| 2019 | $1,436 | $61,800 | $9,760 | $52,040 |
| 2018 | $1,607 | $69,160 | $17,120 | $52,040 |
| 2017 | $1,608 | $69,160 | $17,120 | $52,040 |
| 2016 | $1,664 | $71,440 | $17,120 | $54,320 |
| 2015 | $1,667 | $71,440 | $17,120 | $54,320 |
| 2014 | -- | $71,440 | $17,120 | $54,320 |
| 2013 | -- | $73,440 | $17,120 | $56,320 |
Source: Public Records
Map
Nearby Homes
- 1015 Cherokee Rd
- 110 Gwendolyn Ave
- 102 N Haven Ln
- 206 Londie Ln
- 206 Londe Ln
- 105 Eagles Ridge Ct
- 112 Bainbridge Ln
- 102 Ridge Cir N
- 1729 Milton Way
- 1402 Park Ave
- 411 Stonegate Trail
- 1418 Parkway Dr
- 115 Springfield Ct
- 108 Christine Cir
- 111 Tyndall Way
- 106 Raspberry Trail
- 101 Lighterknot Trail
- 204 Spring Creek Dr
- 1802 Houston Lake Rd
- 108 Ousley Way
- 2024 Laurel Dr
- 2021 Laurel Dr
- 1008 Cherokee Rd
- 2019 Laurel Dr
- 2022 Laurel Dr
- 1006 Cherokee Rd
- 1004 Cherokee Rd
- 2018 Laurel Dr
- 2017 Laurel Dr
- 1002 Cherokee Rd
- 2003 Cedar Ridge Dr
- 1010 Cherokee Rd
- 2016 Laurel Dr
- 2005 Cedar Ridge Dr
- 1005 Cherokee Rd
- 2015 Laurel Dr
- 1009 Cherokee Rd
- 2014 Laurel Dr
- 2028 Northside Rd
- 1000 Country Club Rd
Your Personal Tour Guide
Ask me questions while you tour the home.