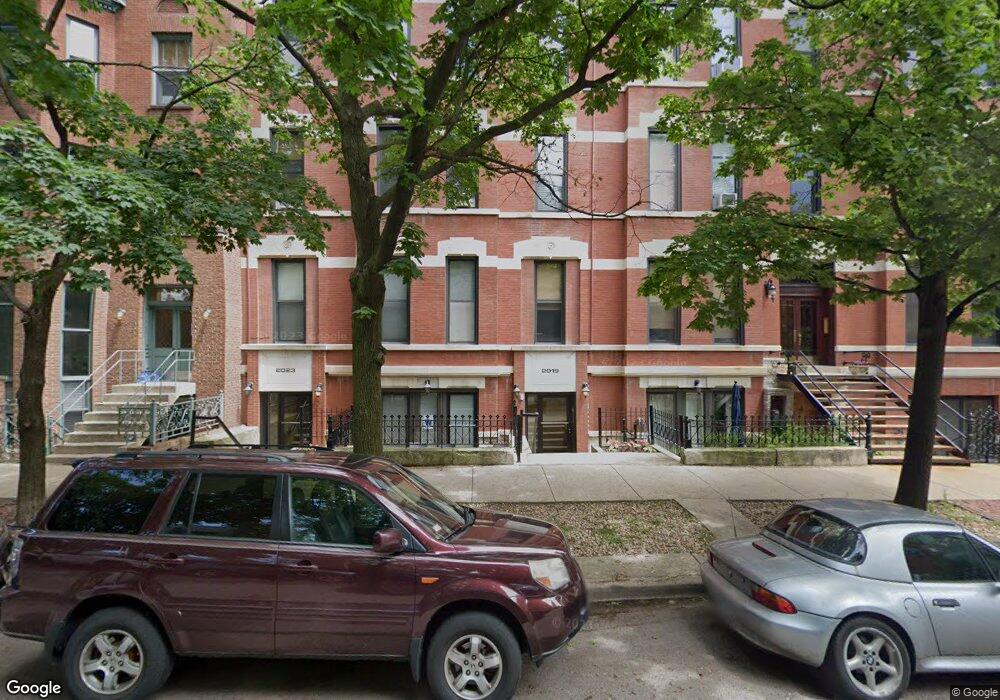
2023 N Cleveland Ave Unit 2023 Chicago, IL 60614
Lincoln Park NeighborhoodEstimated Value: $328,000 - $475,000
1
Bed
1
Bath
750
Sq Ft
$499/Sq Ft
Est. Value
About This Home
This home is located at 2023 N Cleveland Ave Unit 2023, Chicago, IL 60614 and is currently estimated at $374,233, approximately $498 per square foot. 2023 N Cleveland Ave Unit 2023 is a home located in Cook County with nearby schools including Abraham Lincoln Elementary School, Lincoln Park High School, and Francis W Parker School.
Ownership History
Date
Name
Owned For
Owner Type
Purchase Details
Closed on
Sep 26, 2023
Sold by
Vanhandel Stephen M
Bought by
Stephen M Vanhandel Trust and Vanhandel
Current Estimated Value
Purchase Details
Closed on
Mar 11, 2020
Sold by
Poekel William Wherrett
Bought by
Vanhandel Stephen
Home Financials for this Owner
Home Financials are based on the most recent Mortgage that was taken out on this home.
Original Mortgage
$237,500
Interest Rate
2.5%
Mortgage Type
New Conventional
Purchase Details
Closed on
Mar 27, 2013
Sold by
Bolek Thomas E and Bolek Barbara L
Bought by
Poekel William Wherrelt
Home Financials for this Owner
Home Financials are based on the most recent Mortgage that was taken out on this home.
Original Mortgage
$178,000
Interest Rate
3%
Mortgage Type
New Conventional
Purchase Details
Closed on
Dec 3, 2004
Sold by
2019 & 23 Cleveland Llc
Bought by
Bolek Thomas E and Bolek Barbara L
Create a Home Valuation Report for This Property
The Home Valuation Report is an in-depth analysis detailing your home's value as well as a comparison with similar homes in the area
Home Values in the Area
Average Home Value in this Area
Purchase History
| Date | Buyer | Sale Price | Title Company |
|---|---|---|---|
| Stephen M Vanhandel Trust | -- | None Listed On Document | |
| Vanhandel Stephen | $250,000 | Affinity Title | |
| Poekel William Wherrelt | $222,500 | Old Republic National Title | |
| Bolek Thomas E | $285,000 | Ctic |
Source: Public Records
Mortgage History
| Date | Status | Borrower | Loan Amount |
|---|---|---|---|
| Previous Owner | Vanhandel Stephen | $237,500 | |
| Previous Owner | Poekel William Wherrelt | $178,000 |
Source: Public Records
Tax History Compared to Growth
Tax History
| Year | Tax Paid | Tax Assessment Tax Assessment Total Assessment is a certain percentage of the fair market value that is determined by local assessors to be the total taxable value of land and additions on the property. | Land | Improvement |
|---|---|---|---|---|
| 2024 | $4,680 | $30,416 | $6,101 | $24,315 |
| 2023 | $4,540 | $25,496 | $4,920 | $20,576 |
| 2022 | $4,540 | $25,496 | $4,920 | $20,576 |
| 2021 | $4,457 | $25,495 | $4,920 | $20,575 |
| 2020 | $5,399 | $24,235 | $4,329 | $19,906 |
| 2019 | $5,290 | $26,329 | $4,329 | $22,000 |
| 2018 | $5,201 | $26,329 | $4,329 | $22,000 |
| 2017 | $5,185 | $24,085 | $3,542 | $20,543 |
| 2016 | $4,824 | $24,085 | $3,542 | $20,543 |
| 2015 | $4,413 | $24,085 | $3,542 | $20,543 |
| 2014 | $4,458 | $24,026 | $2,656 | $21,370 |
| 2013 | $3,892 | $24,026 | $2,656 | $21,370 |
Source: Public Records
Map
Nearby Homes
- 545 W Dickens Ave
- 2054 N Mohawk St
- 1942 N Sedgwick St Unit PH
- 2334 N Cleveland Ave
- 2007 N Sedgwick St Unit 202
- 401 W Dickens Ave
- 2045 N Larrabee St Unit 7106
- 1848 N Hudson Ave Unit G
- 2035 N Orleans St Unit 2N
- 1849 N Mohawk St Unit 2
- 327 W Armitage Ave Unit 1
- 2020 N Lincoln Park W Unit 30C
- 2020 N Lincoln Park W Unit 3G
- 2020 N Lincoln Park W Unit 30F
- 2020 N Lincoln Park W Unit 7A
- 2020 N Lincoln Park W Unit 18J
- 2020 N Lincoln Park W Unit 3H
- 2020 N Lincoln Park W Unit 36K
- 1960 N Lincoln Park W Unit 1008
- 2042 N Clark St Unit 6S
- 2023 N Cleveland Ave Unit 2E
- 2023 N Cleveland Ave Unit 2023
- 2023 N Cleveland Ave Unit 2023
- 2019 N Cleveland Ave Unit 2019
- 2019 N Cleveland Ave Unit 2019
- 2019 N Cleveland Ave Unit 2019
- 2023 N Cleveland Ave Unit 2023
- 2019 N Cleveland Ave Unit 3P
- 2023 N Cleveland Ave Unit 2023
- 2019 N Cleveland Ave Unit 1P
- 2023 N Cleveland Ave Unit 2023
- 2019 N Cleveland Ave Unit 2P
- 2019 N Cleveland Ave Unit 2019
- 2019 N Cleveland Ave Unit 2019
- 2019 N Cleveland Ave Unit 2019
- 2019 N Cleveland Ave Unit P4
- 2019 N Cleveland Ave Unit P5
- 2023 N Cleveland Ave Unit 3W
- 2023 N Cleveland Ave Unit 1E
- 2019 N Cleveland Ave Unit 3W