2023 N Kalsman Ave Compton, CA 90222
Compton AreaEstimated Value: $677,000 - $756,000
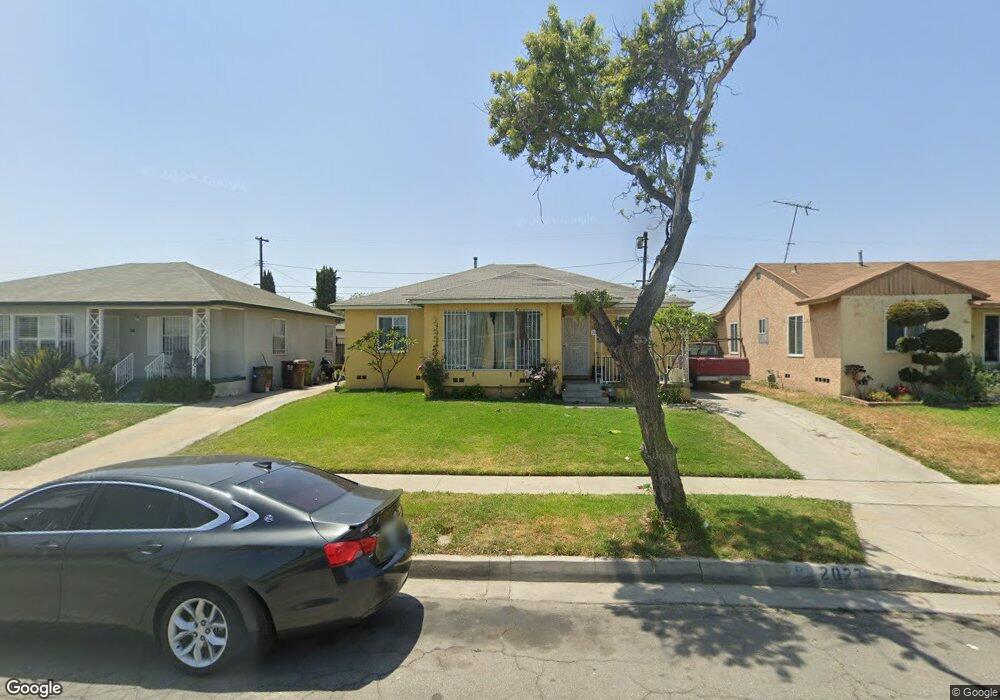
About This Home
This home is located at 2023 N Kalsman Ave, Compton, CA 90222 and is currently estimated at $717,832, approximately $461 per square foot. 2023 N Kalsman Ave is a home located in Los Angeles County with nearby schools including Ronald E. McNair Elementary School, Enterprise Middle School, and Centennial High School.
Ownership History
We collect this data history from publicly available records. To have your information removed, we recommend requesting removal directly through your county’s website.
Purchase Details
Home Financials for this Owner
Home Financials are based on the most recent Mortgage that was taken out on this home.Purchase Details
Home Financials for this Owner
Home Financials are based on the most recent Mortgage that was taken out on this home.Purchase Details
Purchase Details
Home Financials for this Owner
Home Financials are based on the most recent Mortgage that was taken out on this home.Purchase Details
Home Financials for this Owner
Home Financials are based on the most recent Mortgage that was taken out on this home.Purchase Details
Purchase Details
Home Financials for this Owner
Home Financials are based on the most recent Mortgage that was taken out on this home.Purchase Details
Home Financials for this Owner
Home Financials are based on the most recent Mortgage that was taken out on this home.Purchase Details
Home Values in the Area
Average Home Value in this Area
Purchase History
We collect this data history from publicly available records. To have your information removed, we recommend requesting removal directly through your county’s website.
| Date | Buyer | Sale Price | Title Company |
|---|---|---|---|
| -- | Wfg National Title Company | ||
| -- | Wfg National Title Company | ||
| -- | Wfg National Title Company | ||
| -- | Provident Title Company | ||
| -- | Provident Title Company | ||
| -- | Provident Title Company | ||
| -- | Lawyers Title Company | ||
| $210,000 | Lawyers Title Company | ||
| $277,500 | Accommodation | ||
| -- | First American Title Company | ||
| $310,000 | First American Title Company | ||
| $145,000 | -- |
Mortgage History
We collect this data history from publicly available records. To have your information removed, we recommend requesting removal directly through your county’s website.
| Date | Status | Borrower | Loan Amount |
|---|---|---|---|
| Open | $210,000 | ||
| Closed | $170,000 | ||
| Closed | $189,000 | ||
| Previous Owner | $401,200 | ||
| Previous Owner | $248,000 |
Tax History
We collect this data history from publicly available records. To have your information removed, we recommend requesting removal directly through your county’s website.
| Year | Tax Paid | Tax Assessment Tax Assessment Total Assessment is a certain percentage of the fair market value that is determined by local assessors to be the total taxable value of land and additions on the property. | Land | Improvement |
|---|---|---|---|---|
| 2025 | $9,111 | $508,605 | $349,311 | $159,294 |
| 2024 | $9,053 | $498,633 | $342,462 | $156,171 |
| 2023 | $8,936 | $488,857 | $335,748 | $153,109 |
| 2022 | $8,475 | $503,125 | $347,699 | $155,426 |
| 2021 | $8,188 | $469,875 | $322,711 | $147,164 |
| 2019 | $7,894 | $455,940 | $313,140 | $142,800 |
| 2018 | $4,378 | $238,230 | $47,643 | $190,587 |
| 2016 | $4,163 | $228,981 | $45,794 | $183,187 |
| 2015 | $3,982 | $225,543 | $45,107 | $180,436 |
| 2014 | $3,911 | $221,126 | $44,224 | $176,902 |
Map
- 2040 N Kalsman Ave
- 2018 N Parmelee Ave
- 1406 W Stockwell St
- 1318 W Stockwell St
- 1305 W Piru St
- 810 W 133rd St
- 1915 W Stockwell St
- 1210 W 134th St
- 1206 W 134th Place
- 1036 W Stockwell St
- 1218 W 138th St
- 12929 S Central Ave
- 2215 W 132nd St
- 13903 S Zamora Ave
- 1716 N Grandee Ave
- 13941 S Northwood Ave
- 1613 N Grandee Ave
- 924 W 134th Place
- 850 W 132nd St
- 1950 N Bloom Dr
- 2030 N Nestor Ave
- 2024 N Nestor Ave
- 2032 N Nestor Ave
- 2031 N Kalsman Ave
- 2038 N Nestor Ave
- 2027 N Kalsman Ave
- 2035 N Kalsman Ave
- 2039 N Kalsman Ave
- 2016 N Nestor Ave
- 2029 N Nestor Ave
- 2025 N Nestor Ave
- 2035 N Nestor Ave
- 2019 N Kalsman Ave
- 2023 N Nestor Ave
- 2037 N Nestor Ave
- 2012 N Nestor Ave
- 2019 N Nestor Ave
- 2015 N Kalsman Ave
- 1515 W 133rd St
- 1519 W 133rd St
Ask me questions while you tour the home.