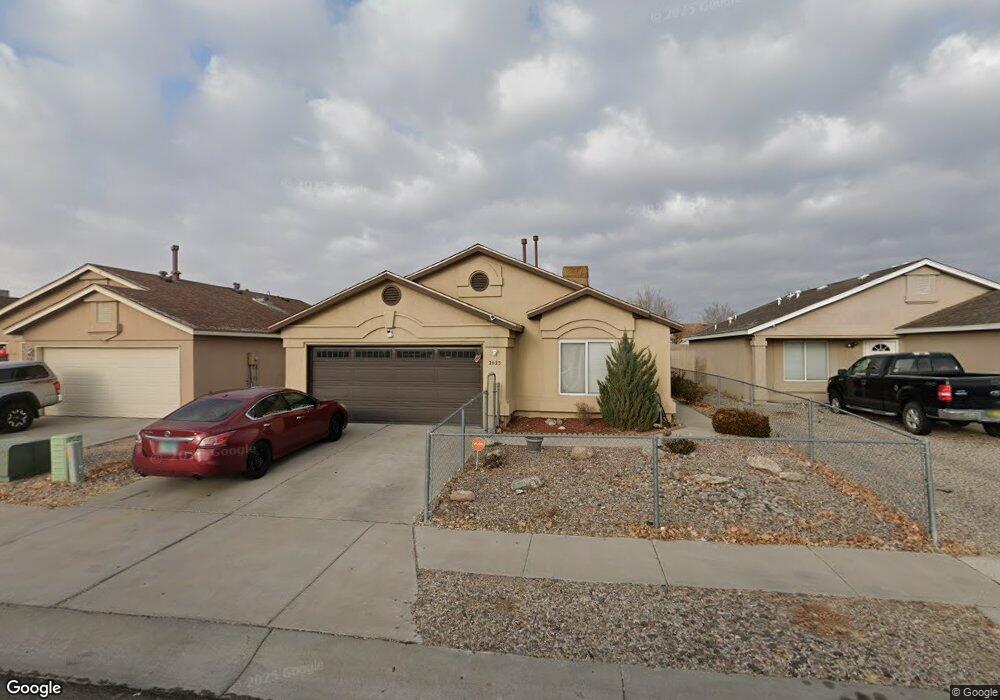
2023 Native Flower Dr SW Albuquerque, NM 87121
Southwest Heights NeighborhoodEstimated Value: $264,000 - $288,721
3
Beds
2
Baths
1,354
Sq Ft
$206/Sq Ft
Est. Value
About This Home
This home is located at 2023 Native Flower Dr SW, Albuquerque, NM 87121 and is currently estimated at $279,180, approximately $206 per square foot. 2023 Native Flower Dr SW is a home located in Bernalillo County with nearby schools including Maryann Binford Elementary School, Truman Middle School, and Rio Grande High School.
Ownership History
Date
Name
Owned For
Owner Type
Purchase Details
Closed on
Feb 27, 2024
Sold by
Burrell Shelia
Bought by
Brill Theresa M and Brill Analisa L
Current Estimated Value
Home Financials for this Owner
Home Financials are based on the most recent Mortgage that was taken out on this home.
Original Mortgage
$8,160
Interest Rate
6.6%
Mortgage Type
New Conventional
Purchase Details
Closed on
Nov 10, 2003
Sold by
Wright Clayton A and Wright Ana Lydia
Bought by
Burrell Shelia
Home Financials for this Owner
Home Financials are based on the most recent Mortgage that was taken out on this home.
Original Mortgage
$95,993
Interest Rate
5.81%
Mortgage Type
FHA
Purchase Details
Closed on
Aug 27, 1998
Sold by
Artistic Homes Inc
Bought by
Wright Clayton A and Wright Ana Lydia
Home Financials for this Owner
Home Financials are based on the most recent Mortgage that was taken out on this home.
Original Mortgage
$83,424
Interest Rate
6.9%
Mortgage Type
FHA
Create a Home Valuation Report for This Property
The Home Valuation Report is an in-depth analysis detailing your home's value as well as a comparison with similar homes in the area
Home Values in the Area
Average Home Value in this Area
Purchase History
| Date | Buyer | Sale Price | Title Company |
|---|---|---|---|
| Brill Theresa M | -- | Fidelity National Title | |
| Burrell Shelia | -- | Stewart Title | |
| Wright Clayton A | -- | First American Title Co Inc |
Source: Public Records
Mortgage History
| Date | Status | Borrower | Loan Amount |
|---|---|---|---|
| Closed | Brill Theresa M | $8,160 | |
| Open | Brill Theresa M | $267,073 | |
| Previous Owner | Burrell Shelia | $95,993 | |
| Previous Owner | Wright Clayton A | $83,424 |
Source: Public Records
Tax History Compared to Growth
Tax History
| Year | Tax Paid | Tax Assessment Tax Assessment Total Assessment is a certain percentage of the fair market value that is determined by local assessors to be the total taxable value of land and additions on the property. | Land | Improvement |
|---|---|---|---|---|
| 2025 | $1,717 | $72,426 | $16,498 | $55,928 |
| 2024 | $1,717 | $40,702 | $11,610 | $29,092 |
| 2023 | $1,689 | $39,517 | $11,272 | $28,245 |
| 2022 | $1,632 | $38,367 | $10,944 | $27,423 |
| 2021 | $1,577 | $37,249 | $10,625 | $26,624 |
| 2020 | $1,551 | $36,165 | $10,316 | $25,849 |
| 2019 | $1,506 | $35,112 | $10,016 | $25,096 |
| 2018 | $1,452 | $35,112 | $10,016 | $25,096 |
| 2017 | $1,408 | $34,089 | $9,724 | $24,365 |
| 2016 | $1,367 | $32,133 | $9,166 | $22,967 |
| 2015 | $31,197 | $31,197 | $8,899 | $22,298 |
| 2014 | $1,337 | $31,497 | $8,899 | $22,598 |
| 2013 | -- | $31,797 | $8,899 | $22,898 |
Source: Public Records
Map
Nearby Homes
- 7901 Purple Fringe Rd SW
- 7814 Desert Canyon Place SW
- 1420 Summerfield Place SW
- 1815 Shadetree Dr SW
- 8600 Kimela Ct SW
- 2503 Sancho Panza Way SW
- 7304 Autumn Sky Rd SW
- 1615 Quiet Desert Dr SW
- 4301 Blake Trailer 40 Rd SW
- 8524 Stony Creek Rd SW
- 1209 Locura Rd SW
- 7605 Windsong Place SW
- 8709 Rhonda Ave SW
- 0 Sage Rd SW Unit 1085259
- 2724 Barcelona Place SW
- 0 Nwq Unser and Sage SW Unit 1081546
- 9300 Jenny Ave SW
- 921 Roma Dora Ln
- 2771 Butch Cassidy Dr SW
- 2528 Coors Blvd SW
- 2101 Native Flower Dr SW
- 2019 Native Flower Dr SW
- 2105 Native Flower Dr SW
- 2015 Native Flower Dr SW
- 7915 Purple Cone Rd SW
- 2109 Native Flower Dr SW
- 2011 Native Flower Dr SW
- 7916 April Flower Rd SW
- 7911 Purple Cone Rd SW
- 2111 Native Flower Dr SW
- 2009 Native Flower Dr SW
- 7916 Purple Cone Rd SW
- 7912 April Flower Rd SW
- 2115 Native Flower Dr SW
- 7909 Purple Cone Rd SW
- 2005 Native Flower Dr SW
- 7912 Purple Cone Rd SW
- 7908 April Flower Rd SW
- 7908 Purple Cone Rd SW
- 7905 Purple Cone Rd SW