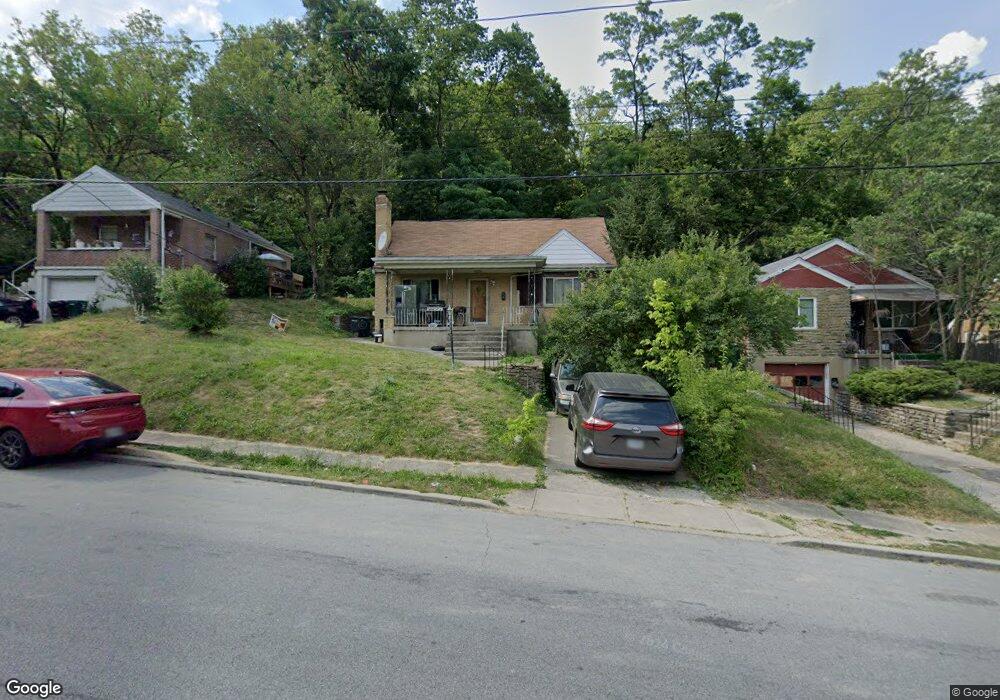
2023 Quebec Rd Cincinnati, OH 45214
South Fairmount NeighborhoodEstimated Value: $82,000 - $159,879
4
Beds
2
Baths
1,575
Sq Ft
$84/Sq Ft
Est. Value
About This Home
This home is located at 2023 Quebec Rd, Cincinnati, OH 45214 and is currently estimated at $131,720, approximately $83 per square foot. 2023 Quebec Rd is a home located in Hamilton County with nearby schools including Gilbert A. Dater High School, Western Hills High School, and Robert A. Taft Information Technology High School.
Ownership History
Date
Name
Owned For
Owner Type
Purchase Details
Closed on
Oct 10, 2021
Sold by
Coumba Samba
Bought by
Diagouraga Moussa
Current Estimated Value
Home Financials for this Owner
Home Financials are based on the most recent Mortgage that was taken out on this home.
Original Mortgage
$148,000
Outstanding Balance
$110,958
Interest Rate
2.23%
Mortgage Type
New Conventional
Estimated Equity
$20,762
Purchase Details
Closed on
Dec 30, 2010
Sold by
Williams Angela S
Bought by
Coumba Samba
Purchase Details
Closed on
Feb 29, 2000
Sold by
Slayback Linda
Bought by
Williams Angela S
Home Financials for this Owner
Home Financials are based on the most recent Mortgage that was taken out on this home.
Original Mortgage
$66,865
Interest Rate
8.3%
Mortgage Type
Unknown
Purchase Details
Closed on
Dec 10, 1997
Sold by
Massengale Jan Cook
Bought by
Yates Lisa M
Home Financials for this Owner
Home Financials are based on the most recent Mortgage that was taken out on this home.
Original Mortgage
$55,100
Interest Rate
7.36%
Purchase Details
Closed on
Aug 30, 1995
Sold by
Espelage Rita M
Bought by
Massengale Jan Cook
Home Financials for this Owner
Home Financials are based on the most recent Mortgage that was taken out on this home.
Original Mortgage
$53,100
Interest Rate
7.55%
Create a Home Valuation Report for This Property
The Home Valuation Report is an in-depth analysis detailing your home's value as well as a comparison with similar homes in the area
Home Values in the Area
Average Home Value in this Area
Purchase History
| Date | Buyer | Sale Price | Title Company |
|---|---|---|---|
| Diagouraga Moussa | $52,950 | Prodigy Title Agency | |
| Coumba Samba | $16,000 | Attorney | |
| Williams Angela S | $66,900 | -- | |
| Yates Lisa M | $58,000 | -- | |
| Massengale Jan Cook | -- | -- |
Source: Public Records
Mortgage History
| Date | Status | Borrower | Loan Amount |
|---|---|---|---|
| Open | Diagouraga Moussa | $148,000 | |
| Previous Owner | Williams Angela S | $66,865 | |
| Previous Owner | Yates Lisa M | $55,100 | |
| Previous Owner | Massengale Jan Cook | $53,100 |
Source: Public Records
Tax History
| Year | Tax Paid | Tax Assessment Tax Assessment Total Assessment is a certain percentage of the fair market value that is determined by local assessors to be the total taxable value of land and additions on the property. | Land | Improvement |
|---|---|---|---|---|
| 2025 | $2,269 | $36,555 | $2,461 | $34,094 |
| 2024 | $2,200 | $36,555 | $2,461 | $34,094 |
| 2023 | $2,250 | $36,555 | $2,461 | $34,094 |
| 2022 | $1,282 | $18,533 | $2,181 | $16,352 |
| 2021 | $1,228 | $18,533 | $2,181 | $16,352 |
| 2020 | $1,263 | $18,533 | $2,181 | $16,352 |
| 2019 | $1,256 | $16,846 | $1,981 | $14,865 |
| 2018 | $1,258 | $16,846 | $1,981 | $14,865 |
| 2017 | $1,195 | $16,846 | $1,981 | $14,865 |
| 2016 | $401 | $5,432 | $2,212 | $3,220 |
| 2015 | $363 | $5,432 | $2,212 | $3,220 |
| 2014 | $365 | $5,432 | $2,212 | $3,220 |
| 2013 | $382 | $5,600 | $2,282 | $3,318 |
Source: Public Records
Map
Nearby Homes
- 1812 Quebec Rd
- 2245 Quebec Rd
- 3320 Freddie Dr
- 1976 Queen City Ave
- 1700 Minion Ave
- 0 Clifford St Unit 1225342
- 1741 Grand Ave
- 2084 Queen City Ave
- 1613 Wyoming Ave
- 1440 Manss Ave
- 3742 Mayfield Ave
- 3744 Mayfield Ave
- 1231 Ridlen Ave
- 1879 Biegler St
- 1875 Biegler St
- 1318 Beech Ave
- 4000 Akochia Ave
- 3320 Glenway Ave
- 2495 Knorr Ave
- 3321 Glenway Ave
- 2019 Quebec Rd
- 2027 Quebec Rd
- 2031 Quebec Rd
- 2015 Quebec Rd
- 2035 Quebec Rd
- 2171 Quebec Rd
- 1943 Quebec Rd
- 2008 Quebec Rd
- 2179 Quebec Rd
- 2004 Quebec Rd
- 2183 Quebec Rd
- 2187 Quebec Rd
- 1942 Quebec Rd
- 1942 Quebec Rd Unit 1944
- 2191 Quebec Rd
- 2193 Quebec Rd
- 2199 Quebec Rd
- 2205 Quebec Rd
- 2211 Quebec Rd
- 3751 Westmont Dr
Your Personal Tour Guide
Ask me questions while you tour the home.