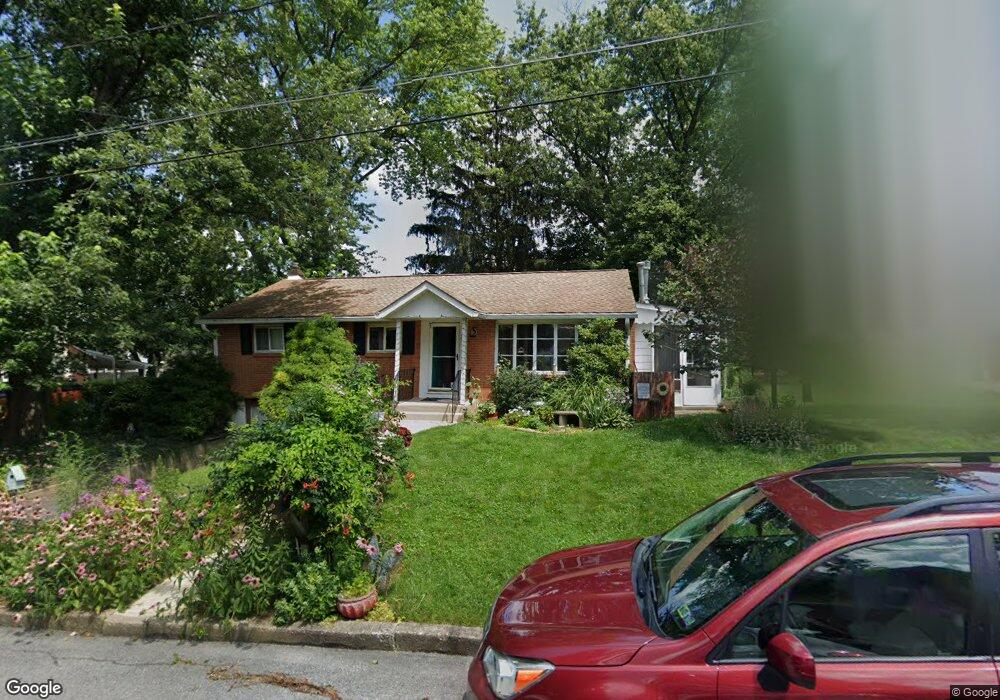
2023 S Aubrey St Unit 2027 Allentown, PA 18103
Southside NeighborhoodEstimated Value: $272,000 - $285,000
3
Beds
1
Bath
1,144
Sq Ft
$243/Sq Ft
Est. Value
About This Home
This home is located at 2023 S Aubrey St Unit 2027, Allentown, PA 18103 and is currently estimated at $278,383, approximately $243 per square foot. 2023 S Aubrey St Unit 2027 is a home located in Lehigh County with nearby schools including Hiram W Dodd Elementary School, South Mountain Middle School, and Louis E. Dieruff High School.
Ownership History
Date
Name
Owned For
Owner Type
Purchase Details
Closed on
Mar 23, 2020
Sold by
Kalkowsky Arlene
Bought by
Kalkowsky Arlene and Mecham Michelle
Current Estimated Value
Purchase Details
Closed on
Aug 18, 2003
Sold by
Foley Michael W and Foley Kimberly A
Bought by
Kalkowsky Arlene
Home Financials for this Owner
Home Financials are based on the most recent Mortgage that was taken out on this home.
Original Mortgage
$104,000
Outstanding Balance
$47,791
Interest Rate
6.22%
Mortgage Type
Purchase Money Mortgage
Estimated Equity
$230,592
Purchase Details
Closed on
Jul 31, 1998
Sold by
Weaver Robert J and Weaver Suzanne V
Bought by
Foley Michael W and Foley Kimberly A
Purchase Details
Closed on
Feb 26, 1991
Sold by
Weaver Wilbur T and Weaver Kathleen T
Bought by
Weaver Robert J and Weaver Suzanne
Purchase Details
Closed on
Dec 29, 1978
Bought by
Weaver Wilbur T and Weaver Kathleen T
Create a Home Valuation Report for This Property
The Home Valuation Report is an in-depth analysis detailing your home's value as well as a comparison with similar homes in the area
Home Values in the Area
Average Home Value in this Area
Purchase History
| Date | Buyer | Sale Price | Title Company |
|---|---|---|---|
| Kalkowsky Arlene | -- | None Available | |
| Kalkowsky Arlene | $132,000 | -- | |
| Foley Michael W | $104,000 | -- | |
| Weaver Robert J | -- | -- | |
| Weaver Wilbur T | $45,000 | -- |
Source: Public Records
Mortgage History
| Date | Status | Borrower | Loan Amount |
|---|---|---|---|
| Open | Kalkowsky Arlene | $104,000 | |
| Closed | Kalkowsky Arlene | $28,000 |
Source: Public Records
Tax History Compared to Growth
Tax History
| Year | Tax Paid | Tax Assessment Tax Assessment Total Assessment is a certain percentage of the fair market value that is determined by local assessors to be the total taxable value of land and additions on the property. | Land | Improvement |
|---|---|---|---|---|
| 2025 | $4,283 | $125,300 | $21,700 | $103,600 |
| 2024 | $4,283 | $125,300 | $21,700 | $103,600 |
| 2023 | $4,283 | $125,300 | $21,700 | $103,600 |
| 2022 | $4,140 | $125,300 | $103,600 | $21,700 |
| 2021 | $4,062 | $125,300 | $21,700 | $103,600 |
| 2020 | $3,961 | $125,300 | $21,700 | $103,600 |
| 2019 | $3,900 | $125,300 | $21,700 | $103,600 |
| 2018 | $3,611 | $125,300 | $21,700 | $103,600 |
| 2017 | $3,523 | $125,300 | $21,700 | $103,600 |
| 2016 | -- | $125,300 | $21,700 | $103,600 |
| 2015 | -- | $125,300 | $21,700 | $103,600 |
| 2014 | -- | $125,300 | $21,700 | $103,600 |
Source: Public Records
Map
Nearby Homes
- 121 Woodcrest Cir
- 2429 S Front St
- 2421 S Wood St
- 206 208 W Emaus Ave
- 1865 Chapel Ave
- 102 W Brookdale St
- 2441 S 4th St
- 1852 S 2nd St
- 316 W Mountain Rd
- 148 W Brookdale St
- 203 W Brookdale St
- 135 W Wabash St
- 320 E Paoli St
- 2416 S Alice St Unit 2418
- 2331 S Filbert St
- 2347 S Law St Unit 2349
- 127 E Lynnwood St
- 566 W Emaus Ave
- 566 588 W Emaus Ave
- 618 Clifford St
- 2022 S Bradford St
- 2028 S Bradford St Unit 2032
- 2015 S Aubrey St
- 2035 S Aubrey St
- 2013 S Aubrey St Unit 2017
- 2026 S Aubrey St Unit 2032
- 2018 S Aubrey St Unit 2024
- 2010 S Bradford St
- 2034 S Bradford St Unit 2042
- 2042 S Bradford St
- 2038 S Aubrey St Unit 2042
- 2008 S Aubrey St Unit 2016
- 2006 S Bradford St
- 2021 S Bradford St
- 2025 S Albert St Unit 2027
- 2037 S Bradford St
- 2002 S Bradford St Unit 2010
- 2015 S Albert St Unit 2023
- 2031 S Albert St
- 2033 S Albert St Unit 2035