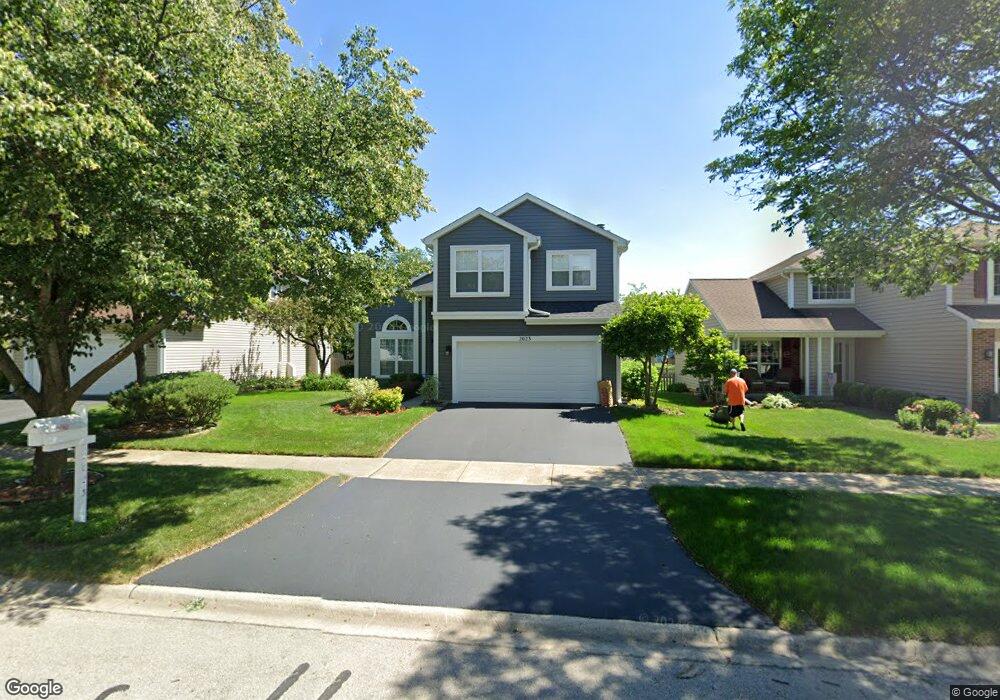
2023 Spice Ln Unit 1 Naperville, IL 60565
Greene Valley NeighborhoodEstimated Value: $515,418 - $615,000
--
Bed
1
Bath
1,917
Sq Ft
$292/Sq Ft
Est. Value
About This Home
This home is located at 2023 Spice Ln Unit 1, Naperville, IL 60565 and is currently estimated at $559,855, approximately $292 per square foot. 2023 Spice Ln Unit 1 is a home located in DuPage County with nearby schools including Ranch View Elementary School, Kennedy Junior High School, and Naperville Central High School.
Ownership History
Date
Name
Owned For
Owner Type
Purchase Details
Closed on
Mar 23, 2000
Sold by
Tabbara Abdul Ghany and Tabbara Hind
Bought by
Wang Guoping and Xu Hexia
Current Estimated Value
Home Financials for this Owner
Home Financials are based on the most recent Mortgage that was taken out on this home.
Original Mortgage
$187,600
Interest Rate
7.75%
Purchase Details
Closed on
May 29, 1998
Sold by
Piegat Thomas M and Piegat Theresa M
Bought by
Tabbara Abdulghany and Tabbara Hind
Home Financials for this Owner
Home Financials are based on the most recent Mortgage that was taken out on this home.
Original Mortgage
$204,300
Interest Rate
7.22%
Purchase Details
Closed on
Jul 8, 1993
Sold by
Harris Bank Hinsdale
Bought by
Piegat Thomas M and Piegat Theresa M
Home Financials for this Owner
Home Financials are based on the most recent Mortgage that was taken out on this home.
Original Mortgage
$164,700
Interest Rate
7.05%
Create a Home Valuation Report for This Property
The Home Valuation Report is an in-depth analysis detailing your home's value as well as a comparison with similar homes in the area
Home Values in the Area
Average Home Value in this Area
Purchase History
| Date | Buyer | Sale Price | Title Company |
|---|---|---|---|
| Wang Guoping | $234,500 | Residential Title Services | |
| Tabbara Abdulghany | $227,000 | -- | |
| Piegat Thomas M | $177,500 | -- |
Source: Public Records
Mortgage History
| Date | Status | Borrower | Loan Amount |
|---|---|---|---|
| Previous Owner | Wang Guoping | $187,600 | |
| Previous Owner | Tabbara Abdulghany | $204,300 | |
| Previous Owner | Piegat Thomas M | $164,700 | |
| Closed | Wang Guoping | $23,450 |
Source: Public Records
Tax History Compared to Growth
Tax History
| Year | Tax Paid | Tax Assessment Tax Assessment Total Assessment is a certain percentage of the fair market value that is determined by local assessors to be the total taxable value of land and additions on the property. | Land | Improvement |
|---|---|---|---|---|
| 2024 | $8,623 | $156,762 | $54,062 | $102,700 |
| 2023 | $8,777 | $143,070 | $49,340 | $93,730 |
| 2022 | $8,029 | $130,060 | $44,850 | $85,210 |
| 2021 | $7,733 | $125,140 | $43,150 | $81,990 |
| 2020 | $7,567 | $122,890 | $42,370 | $80,520 |
| 2019 | $7,344 | $117,580 | $40,540 | $77,040 |
| 2018 | $7,346 | $117,580 | $40,540 | $77,040 |
| 2017 | $7,196 | $113,610 | $39,170 | $74,440 |
| 2016 | $7,050 | $109,500 | $37,750 | $71,750 |
| 2015 | $7,001 | $103,120 | $35,550 | $67,570 |
| 2014 | $6,863 | $98,210 | $33,860 | $64,350 |
| 2013 | $6,760 | $98,440 | $33,940 | $64,500 |
Source: Public Records
Map
Nearby Homes
- 1817 Appaloosa Dr
- 1877 Appaloosa Dr
- 1519 77th St
- 1509 Shiva Ln
- 1704 Kenyon Dr
- 1501 Clarkson Ct
- 23W731 Hobson Rd
- 1323 Auburn Ave
- 7S610 Lynn Dr
- 1006 Bankfield Ct
- 6812 Greene Rd
- 1449 Whitespire Ct Unit 5104
- 523 Orleans Ave
- 6551 Shagbark Ct Unit 2
- 8S452 Bell Dr
- 621 Bourbon Ct
- 2248 Aster Ct
- 816 Spindletree Ave
- 1105 Johnson Dr
- 3207 Foxridge Ct