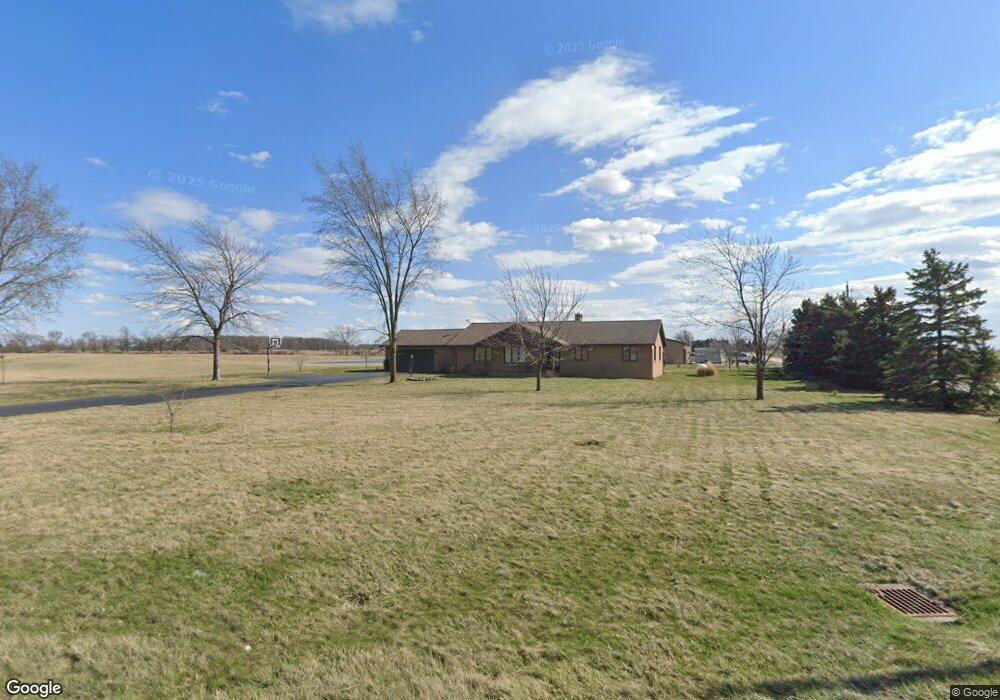
2023 State Route 613 Mc Comb, OH 45858
McComb NeighborhoodEstimated Value: $297,000 - $373,000
3
Beds
3
Baths
1,823
Sq Ft
$183/Sq Ft
Est. Value
About This Home
This home is located at 2023 State Route 613, Mc Comb, OH 45858 and is currently estimated at $334,259, approximately $183 per square foot. 2023 State Route 613 is a home located in Hancock County with nearby schools including McComb Elementary School, McComb Middle School, and Mccomb Local High School.
Ownership History
Date
Name
Owned For
Owner Type
Purchase Details
Closed on
Oct 23, 2017
Sold by
Cass David R and Cass Frances M
Bought by
Atta Samuel E Van and Atta Kristina H Van
Current Estimated Value
Home Financials for this Owner
Home Financials are based on the most recent Mortgage that was taken out on this home.
Original Mortgage
$234,025
Outstanding Balance
$195,267
Interest Rate
3.78%
Mortgage Type
New Conventional
Estimated Equity
$138,992
Purchase Details
Closed on
May 31, 2002
Sold by
Cogley Jacob L
Bought by
Cass David R and Cass Frances M
Home Financials for this Owner
Home Financials are based on the most recent Mortgage that was taken out on this home.
Original Mortgage
$40,000
Interest Rate
7%
Mortgage Type
New Conventional
Purchase Details
Closed on
Dec 15, 1989
Bought by
Cogley Jacob L and Cogley Doris M
Create a Home Valuation Report for This Property
The Home Valuation Report is an in-depth analysis detailing your home's value as well as a comparison with similar homes in the area
Home Values in the Area
Average Home Value in this Area
Purchase History
| Date | Buyer | Sale Price | Title Company |
|---|---|---|---|
| Atta Samuel E Van | $250,000 | None Available | |
| Cass David R | $185,000 | -- | |
| Cogley Jacob L | $16,300 | -- |
Source: Public Records
Mortgage History
| Date | Status | Borrower | Loan Amount |
|---|---|---|---|
| Open | Atta Samuel E Van | $234,025 | |
| Closed | Cass David R | $40,000 |
Source: Public Records
Tax History Compared to Growth
Tax History
| Year | Tax Paid | Tax Assessment Tax Assessment Total Assessment is a certain percentage of the fair market value that is determined by local assessors to be the total taxable value of land and additions on the property. | Land | Improvement |
|---|---|---|---|---|
| 2024 | $3,120 | $94,090 | $14,790 | $79,300 |
| 2023 | $3,100 | $94,090 | $14,790 | $79,300 |
| 2022 | $3,179 | $94,090 | $14,790 | $79,300 |
| 2021 | $3,002 | $78,550 | $14,410 | $64,140 |
| 2020 | $2,996 | $78,550 | $14,410 | $64,140 |
| 2019 | $2,856 | $78,550 | $14,410 | $64,140 |
| 2018 | $2,448 | $70,990 | $12,530 | $58,460 |
| 2017 | $1,233 | $70,990 | $12,530 | $58,460 |
| 2016 | $2,284 | $70,990 | $12,530 | $58,460 |
| 2015 | $2,033 | $62,320 | $12,530 | $49,790 |
| 2014 | $2,018 | $61,880 | $12,530 | $49,350 |
| 2012 | $2,165 | $61,880 | $12,530 | $49,350 |
Source: Public Records
Map
Nearby Homes
- 3699 State Route 613
- 358 State Route 613
- 223 N Church St
- 223 Cherry St
- 0 Joshua Rd Unit 6126475
- 102 Meadowshire Dr
- 5330 State Route 186
- 4134 County Road 203
- 3019 Ohio 235
- 1381 County Road 5
- 687 State Route 235
- D273 Co Rd 1
- 9984 State Route 235
- 7780 Township Road 89
- 132 Main St
- 4629 State Route 65
- 8922 Township Road 94
- 60 Rush St
- 11698 Township Rd
- 634 Ohio St
- 2148 Ohio 613
- 2148 State Route 613
- 5091 County Road 53
- 5091 C R 53
- 0 County Road 53
- 2245 State Route 613
- 1679 Ohio 613
- 1679 State Route 613
- 5349 C R 53
- 5320 County Road 53
- 5349 County Road 53
- 5374 County Road 53
- 5428 County Road 53
- 1518 State Route 613
- 1471 State Route 613
- 4504 Township Road 119
- 2778 Township Road 97
- 4875 Township Road 120
- 4921 Township Road 120
- 4320 Township Road 119