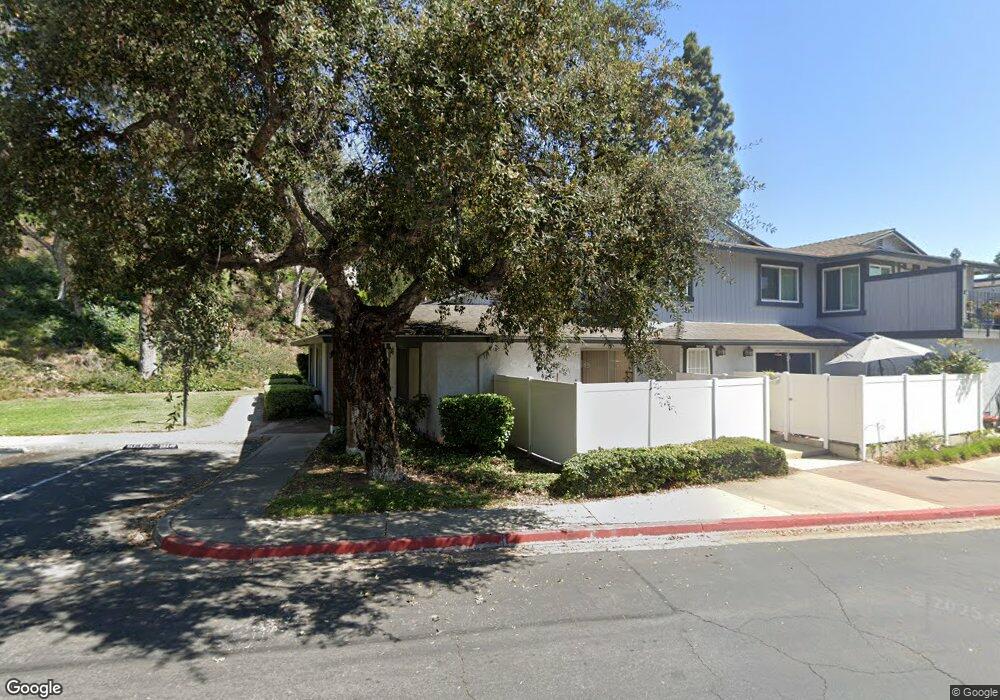
20237 Clear River Ln Unit 1 Yorba Linda, CA 92886
Estimated Value: $677,131 - $804,000
3
Beds
2
Baths
1,095
Sq Ft
$656/Sq Ft
Est. Value
About This Home
This home is located at 20237 Clear River Ln Unit 1, Yorba Linda, CA 92886 and is currently estimated at $718,033, approximately $655 per square foot. 20237 Clear River Ln Unit 1 is a home located in Orange County with nearby schools including Glenknoll Elementary, Bernardo Yorba Middle School, and Ivycrest Montessori Private School - Yorba Linda.
Ownership History
Date
Name
Owned For
Owner Type
Purchase Details
Closed on
Sep 11, 2024
Sold by
Jackson/Packer Trust and Nuttall Bruce R
Bought by
Jackson Andrew W
Current Estimated Value
Purchase Details
Closed on
Aug 8, 2014
Sold by
Jackson William Roy
Bought by
Jackson William Roy and Jackson Packer Trust Trust A
Purchase Details
Closed on
Feb 13, 1996
Sold by
Jackson William Roy and Jackson Anne M
Bought by
Jackson William Roy and Jackson Anne M
Purchase Details
Closed on
Dec 1, 1995
Sold by
World S & L Assn
Bought by
Jackson Andrew and Jackson William R
Home Financials for this Owner
Home Financials are based on the most recent Mortgage that was taken out on this home.
Original Mortgage
$107,100
Interest Rate
7.47%
Mortgage Type
FHA
Purchase Details
Closed on
Sep 22, 1995
Sold by
Lee Wayne H
Bought by
World S & L Assn
Create a Home Valuation Report for This Property
The Home Valuation Report is an in-depth analysis detailing your home's value as well as a comparison with similar homes in the area
Home Values in the Area
Average Home Value in this Area
Purchase History
| Date | Buyer | Sale Price | Title Company |
|---|---|---|---|
| Jackson Andrew W | -- | None Listed On Document | |
| Jackson William Roy | -- | None Available | |
| Jackson William Roy | -- | -- | |
| Jackson Andrew | $110,000 | Fidelity National Title Ins | |
| World S & L Assn | $115,507 | -- |
Source: Public Records
Mortgage History
| Date | Status | Borrower | Loan Amount |
|---|---|---|---|
| Previous Owner | Jackson Andrew | $107,100 |
Source: Public Records
Tax History Compared to Growth
Tax History
| Year | Tax Paid | Tax Assessment Tax Assessment Total Assessment is a certain percentage of the fair market value that is determined by local assessors to be the total taxable value of land and additions on the property. | Land | Improvement |
|---|---|---|---|---|
| 2025 | $2,376 | $523,301 | $407,548 | $115,753 |
| 2024 | $2,376 | $179,139 | $60,821 | $118,318 |
| 2023 | $2,323 | $175,627 | $59,628 | $115,999 |
| 2022 | $2,273 | $172,184 | $58,459 | $113,725 |
| 2021 | $2,243 | $168,808 | $57,312 | $111,496 |
| 2020 | $2,176 | $167,078 | $56,725 | $110,353 |
| 2019 | $2,107 | $163,802 | $55,612 | $108,190 |
| 2018 | $2,079 | $160,591 | $54,522 | $106,069 |
| 2017 | $2,044 | $157,443 | $53,453 | $103,990 |
| 2016 | $2,004 | $154,356 | $52,405 | $101,951 |
| 2015 | $1,979 | $152,038 | $51,618 | $100,420 |
| 2014 | $1,922 | $149,060 | $50,607 | $98,453 |
Source: Public Records
Map
Nearby Homes
- 20267 Clear River Ln Unit 7
- 20453 Elm Hill Ln Unit 26
- 20065 Berkeley Way
- 6375 Tiburon Terrace
- 6437 Horse Shoe Ln Unit 2
- 6473 Horse Shoe Ln Unit 6
- 6478 Horse Shoe Ln Unit 9
- 6305 Saint Francis Ct
- 20180 Pingree Way
- 19816 White Spring Ln Unit 36
- 6821 Rocky Grove Ct Unit 13
- 20002 Wrightwood Ct Unit 31
- 1290 N Tippetts Ln
- 19931 Crestknoll Dr
- 20415 Herbshey Cir
- 6692 Palma Cir
- 6681 Palma Cir
- 6692 Moselle Cir
- 6635 Bridle Cir
- 20520 Via Magdalena
- 20243 Clear River Ln Unit 2
- 20249 Clear River Ln Unit 3
- 20253 Clear River Ln Unit 4
- 20164 Clear River Ln Unit 20
- 20164 Clear River Ln
- 20170 Clear River Ln
- 20176 Clear River Ln Unit 18
- 20267 Clear River Ln
- 20273 Clear River Ln Unit 6
- 20180 Clear River Ln Unit 17
- 20261 Clear River Ln Unit 8
- 20140 Clear River Ln Unit 21
- 20252 Clear River Ln Unit 14
- 20279 Clear River Ln Unit 5
- 20146 Clear River Ln Unit 22
- 20258 Clear River Ln Unit 15
- 20152 Clear River Ln Unit 23
- 20246 Clear River Ln Unit 13
- 20158 Clear River Ln Unit 24
- 20264 Clear River Ln Unit 16