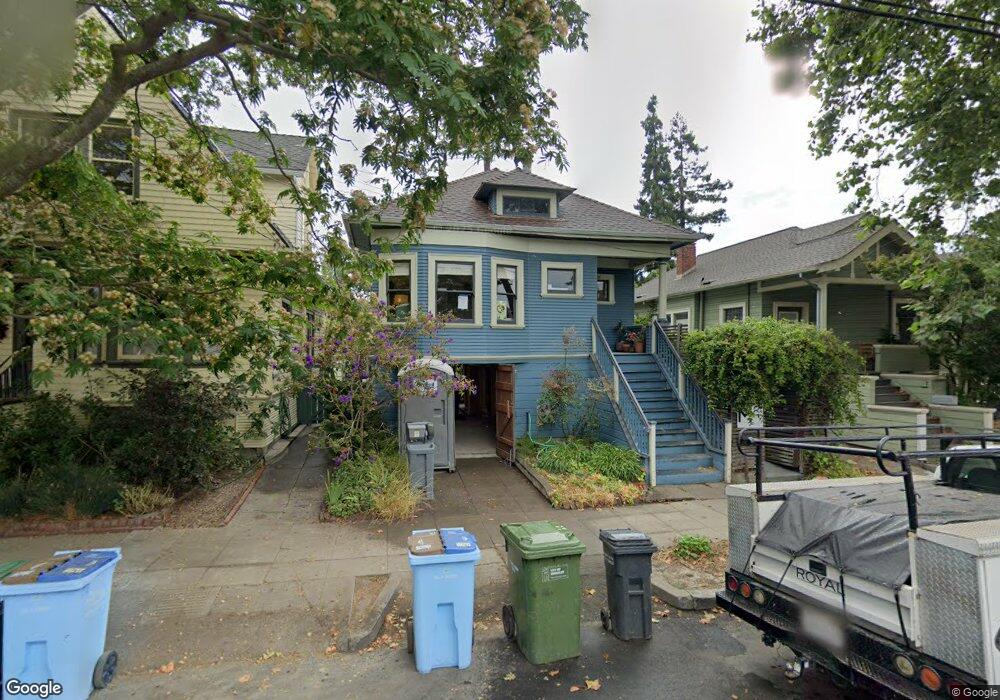
2024 Essex St Berkeley, CA 94703
South Berkeley NeighborhoodEstimated Value: $1,146,000 - $1,841,000
3
Beds
3
Baths
1,296
Sq Ft
$1,139/Sq Ft
Est. Value
About This Home
This home is located at 2024 Essex St, Berkeley, CA 94703 and is currently estimated at $1,476,035, approximately $1,138 per square foot. 2024 Essex St is a home located in Alameda County with nearby schools including Malcolm X Elementary School, Emerson Elementary School, and John Muir Elementary School.
Ownership History
Date
Name
Owned For
Owner Type
Purchase Details
Closed on
Sep 18, 2017
Sold by
Carpenter John R and Krasinski Alice A
Bought by
Low Trisha Ya Wen
Current Estimated Value
Create a Home Valuation Report for This Property
The Home Valuation Report is an in-depth analysis detailing your home's value as well as a comparison with similar homes in the area
Home Values in the Area
Average Home Value in this Area
Purchase History
| Date | Buyer | Sale Price | Title Company |
|---|---|---|---|
| Low Trisha Ya Wen | $1,360,000 | Chicago Title Company |
Source: Public Records
Tax History Compared to Growth
Tax History
| Year | Tax Paid | Tax Assessment Tax Assessment Total Assessment is a certain percentage of the fair market value that is determined by local assessors to be the total taxable value of land and additions on the property. | Land | Improvement |
|---|---|---|---|---|
| 2025 | $22,038 | $1,540,421 | $464,226 | $1,083,195 |
| 2024 | $22,038 | $1,511,480 | $455,124 | $1,061,956 |
| 2023 | $21,560 | $1,487,336 | $446,201 | $1,041,135 |
| 2022 | $21,397 | $1,458,177 | $437,453 | $1,020,724 |
| 2021 | $21,490 | $1,429,590 | $428,877 | $1,000,713 |
| 2020 | $20,549 | $1,414,943 | $424,483 | $990,460 |
| 2019 | $19,955 | $1,387,200 | $416,160 | $971,040 |
| 2018 | $19,653 | $1,360,000 | $408,000 | $952,000 |
| 2017 | $6,213 | $287,989 | $58,877 | $229,112 |
| 2016 | $5,940 | $282,344 | $57,723 | $224,621 |
| 2015 | $5,835 | $278,103 | $56,856 | $221,247 |
| 2014 | $5,747 | $272,655 | $55,742 | $216,913 |
Source: Public Records
Map
Nearby Homes
- 3050 Shattuck Ave
- 1922 Woolsey St
- 2057 Emerson St
- 2110 Ashby Ave
- 2918 Newbury St
- 669 Alcatraz Ave
- 667 & 667A Alcatraz Ave
- 667 Alcatraz Ave
- 641 63rd St
- 1812 Woolsey St
- 3047 Halcyon Ct
- 2926 Ellis St
- 3233 Ellis St
- 1628 Tyler St
- 480 62nd St
- 2417 Webster St
- 470 62nd St
- 739 61st St
- 737 61st St
- 5963 Maccall St