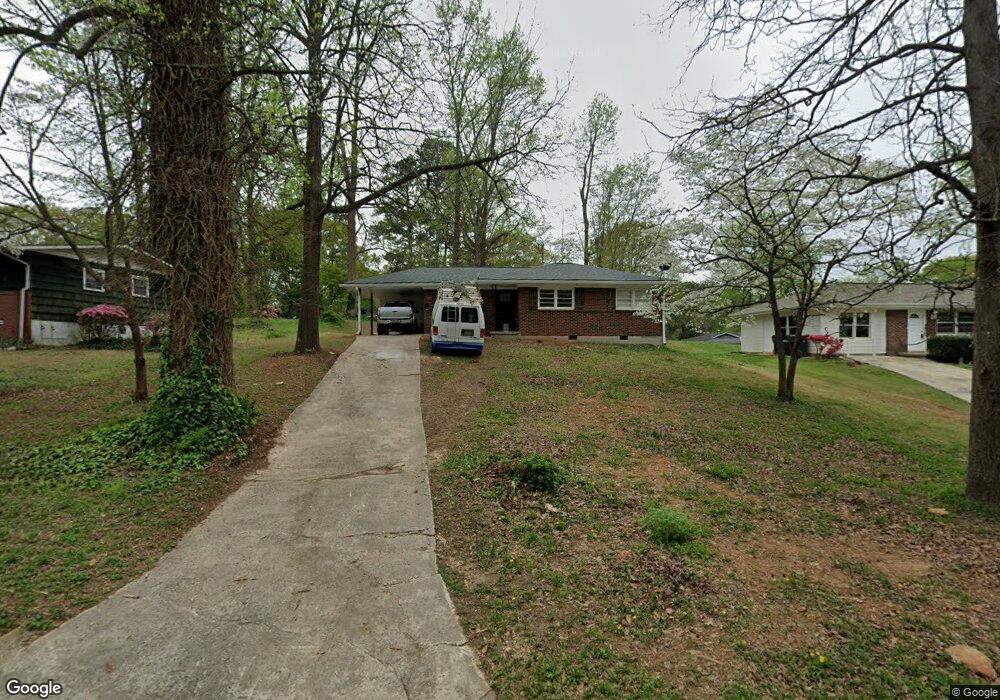
2024 Frank Ln SE Marietta, GA 30060
Southwestern Marietta NeighborhoodEstimated Value: $229,000 - $300,000
3
Beds
1
Bath
852
Sq Ft
$307/Sq Ft
Est. Value
About This Home
This home is located at 2024 Frank Ln SE, Marietta, GA 30060 and is currently estimated at $261,265, approximately $306 per square foot. 2024 Frank Ln SE is a home located in Cobb County with nearby schools including Belmont Hills Elementary School, Osborne High School, and International Academy of Smyrna.
Ownership History
Date
Name
Owned For
Owner Type
Purchase Details
Closed on
Oct 31, 2025
Sold by
Perez Rabanales Osiel Exsau
Bought by
Dgs Residential Properties Llc
Current Estimated Value
Home Financials for this Owner
Home Financials are based on the most recent Mortgage that was taken out on this home.
Original Mortgage
$225,000
Outstanding Balance
$225,000
Interest Rate
6.26%
Mortgage Type
New Conventional
Estimated Equity
$36,265
Purchase Details
Closed on
May 20, 2024
Sold by
Kings House Properties Llc
Bought by
Perez Rabanales Osiel Exsau
Home Financials for this Owner
Home Financials are based on the most recent Mortgage that was taken out on this home.
Original Mortgage
$233,600
Interest Rate
7.17%
Mortgage Type
New Conventional
Purchase Details
Closed on
Dec 29, 2023
Sold by
Patriot Home Buyers Llc
Bought by
Kingshouse Properties Llc
Purchase Details
Closed on
Oct 4, 2023
Sold by
Parr Sheila Ann
Bought by
Fullerton Liddie Pauline
Purchase Details
Closed on
Feb 11, 2019
Sold by
Renfroe Martha A
Bought by
Renfroe Martha A and Fullerton Liddie Pauline
Purchase Details
Closed on
Oct 20, 2014
Sold by
Dollar Harriett Jacklyn
Bought by
Renfroe Martha A
Create a Home Valuation Report for This Property
The Home Valuation Report is an in-depth analysis detailing your home's value as well as a comparison with similar homes in the area
Home Values in the Area
Average Home Value in this Area
Purchase History
| Date | Buyer | Sale Price | Title Company |
|---|---|---|---|
| Dgs Residential Properties Llc | $300,000 | Titles Inked | |
| Perez Rabanales Osiel Exsau | $292,000 | None Listed On Document | |
| Kingshouse Properties Llc | $205,000 | None Listed On Document | |
| Patriot Home Buyers Llc | $176,500 | None Listed On Document | |
| Fullerton Liddie Pauline | -- | None Listed On Document | |
| Renfroe Martha A | -- | -- | |
| Renfroe Martha A | -- | -- |
Source: Public Records
Mortgage History
| Date | Status | Borrower | Loan Amount |
|---|---|---|---|
| Open | Dgs Residential Properties Llc | $225,000 | |
| Previous Owner | Perez Rabanales Osiel Exsau | $233,600 |
Source: Public Records
Tax History Compared to Growth
Tax History
| Year | Tax Paid | Tax Assessment Tax Assessment Total Assessment is a certain percentage of the fair market value that is determined by local assessors to be the total taxable value of land and additions on the property. | Land | Improvement |
|---|---|---|---|---|
| 2025 | $3,076 | $102,100 | $24,000 | $78,100 |
| 2024 | $2,472 | $82,000 | $23,920 | $58,080 |
| 2023 | $2,479 | $82,232 | $24,000 | $58,232 |
| 2022 | $1,982 | $65,312 | $18,000 | $47,312 |
| 2021 | $1,537 | $50,632 | $14,000 | $36,632 |
| 2020 | $1,537 | $50,632 | $14,000 | $36,632 |
| 2019 | $773 | $25,472 | $12,000 | $13,472 |
| 2018 | $773 | $25,472 | $12,000 | $13,472 |
| 2017 | $559 | $19,432 | $4,800 | $14,632 |
| 2016 | $433 | $15,052 | $4,800 | $10,252 |
| 2015 | $443 | $15,052 | $4,800 | $10,252 |
| 2014 | $447 | $15,052 | $0 | $0 |
Source: Public Records
Map
Nearby Homes
- 1958 Judy Cir SE
- 2177 Wakita Dr SE
- 1840 Judy Cir SE
- 2078 Olive Springs Rd SE
- 7004 Pat Mell Place SE
- 355 Benson Manor Cir SE
- 285 Windy Hill Rd SE
- 2245 Panstone Dr SW
- 152 Summer Lake Dr SW
- 1670 Concord Dr SE
- 2185 Trailwood Dr SE
- 2305 Ventura Rd SE
- 2379 Olive Springs Rd SE
- 29 Burke St SE
- 2275 Old Spring Rd SE
- 81 Cochran Rd SE
- 2039 Gober Ave SE
- 235 Still Pine Bend
- 2028 Frank Ln SE
- 0 Frank Ln SE Unit 3175814
- 0 Frank Ln SE Unit 8809155
- 0 Frank Ln SE Unit 8485107
- 2016 Frank Ln SE
- 233 Dink Ln SE Unit 2
- 2063 Mills Ln SE
- 2045 Mills Ln SE
- 2069 Mills Ln SE
- 2025 Frank Ln SE Unit 6
- 2019 Frank Ln SE
- 231 Dink Ln SE
- 229 Dink Ln SE
- 2036 Frank Ln SE
- 2075 Mills Ln SE
- 2015 Frank Ln SE Unit 2
- 257 Dink Ln SE
- 2026 Mills Ln SE
- 2035 Frank Ln SE
- 204 Spring Valley Rd SE