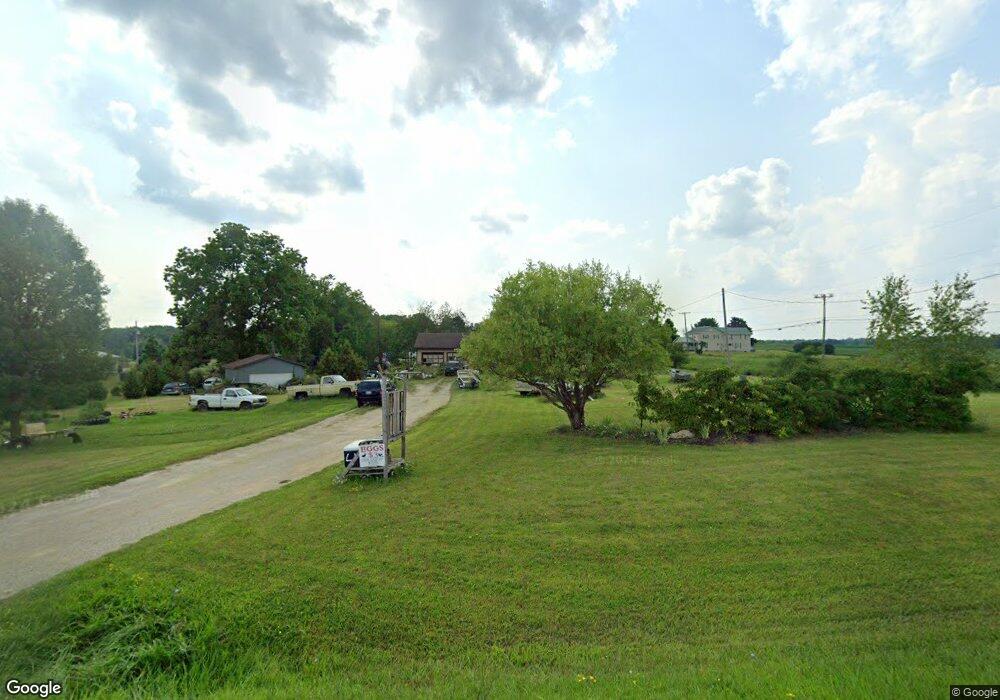
2024 Morey Hwy Unit MOREY Clayton, MI 49235
Estimated Value: $206,137 - $216,000
3
Beds
2
Baths
1,287
Sq Ft
$165/Sq Ft
Est. Value
About This Home
This home is located at 2024 Morey Hwy Unit MOREY, Clayton, MI 49235 and is currently estimated at $212,046, approximately $164 per square foot. 2024 Morey Hwy Unit MOREY is a home located in Lenawee County with nearby schools including Lincoln Elementary School, Southern Michigan Center For Science & Industry (SMCSI), and Hudson Middle School.
Ownership History
Date
Name
Owned For
Owner Type
Purchase Details
Closed on
Mar 10, 2010
Sold by
Fowler June E
Bought by
Fowler June E and Fowler David L
Current Estimated Value
Purchase Details
Closed on
Sep 30, 2009
Sold by
Goedert Mark H and Goedert Rebeca M
Bought by
Fowler June E
Home Financials for this Owner
Home Financials are based on the most recent Mortgage that was taken out on this home.
Original Mortgage
$58,900
Outstanding Balance
$38,598
Interest Rate
5.15%
Mortgage Type
New Conventional
Estimated Equity
$173,448
Purchase Details
Closed on
Jun 10, 2009
Sold by
Federal Deposit Insurance Corporation
Bought by
Jpmorgan Chase Bank Na
Purchase Details
Closed on
Feb 25, 2009
Sold by
Gatt Glenn
Bought by
Goedert Mark H and Goedert Rebeca M
Purchase Details
Closed on
Apr 3, 2008
Sold by
Griewahn Kris W and Griewahn Cynthia D
Bought by
Washington Mutual Bank
Create a Home Valuation Report for This Property
The Home Valuation Report is an in-depth analysis detailing your home's value as well as a comparison with similar homes in the area
Home Values in the Area
Average Home Value in this Area
Purchase History
| Date | Buyer | Sale Price | Title Company |
|---|---|---|---|
| Fowler June E | -- | Prestige Title Insurance Age | |
| Fowler June E | $62,000 | Prestige Title Insurance Age | |
| Jpmorgan Chase Bank Na | -- | Able Title Agency Llc | |
| Goedert Mark H | -- | None Available | |
| Gatt Glenn | $34,000 | Able Title Agency Llc | |
| Washington Mutual Bank | $37,000 | None Available |
Source: Public Records
Mortgage History
| Date | Status | Borrower | Loan Amount |
|---|---|---|---|
| Open | Fowler June E | $58,900 |
Source: Public Records
Tax History Compared to Growth
Tax History
| Year | Tax Paid | Tax Assessment Tax Assessment Total Assessment is a certain percentage of the fair market value that is determined by local assessors to be the total taxable value of land and additions on the property. | Land | Improvement |
|---|---|---|---|---|
| 2025 | $1,640 | $102,600 | $0 | $0 |
| 2024 | $645 | $97,800 | $0 | $0 |
| 2022 | $566 | $75,500 | $0 | $0 |
| 2021 | $1,466 | $67,700 | $0 | $0 |
| 2020 | $1,449 | $51,800 | $0 | $0 |
| 2019 | $135,676 | $51,900 | $0 | $0 |
| 2018 | $1,397 | $51,854 | $0 | $0 |
| 2017 | $1,395 | $47,532 | $0 | $0 |
| 2016 | $1,317 | $47,031 | $0 | $0 |
| 2014 | -- | $46,547 | $0 | $0 |
Source: Public Records
Map
Nearby Homes
- 3150 State St
- 10139 Cadmus Rd
- 3601 Seneca St
- 11495 W Carleton Rd
- 9024 W Carleton Rd
- 4182 Whaley Hwy
- V/L Forrister Rd
- 6712 W Cadmus Rd
- 10512 Rome Rd
- 17023 Mill St
- 15300 Rome Rd
- 9875 Stoddard Rd
- 6993 Morey Hwy
- 8320 W Us-23 Hwy
- 5576 W Beecher Rd
- 3951 Woerner Rd
- 4691 & 4000 Woerner Rd
- 11943 U S 223
- 3953 Woerner Rd
- 111 & 115 N Market St
- 2024 Morey Hwy
- 11124 Beecher Rd
- 11155 Beecher Rd
- 11166 Beecher Rd
- 2134 Morey Hwy Unit BLK
- 10952 Beecher Rd
- 11285 Beecher Rd
- 10831 Beecher Rd
- 2256 Morey Hwy
- 10816 Beecher Rd
- 10641 Beecher Rd
- 10674 Beecher Rd
- 11435 Beecher Rd
- 10920 Beecher Rd
- 10920 Beecher Rd
- 10539 Beecher Rd
- 1318 Morey Hwy
- 2485 Morey Hwy
- 1314 Morey Hwy
- 1315 Morey Hwy