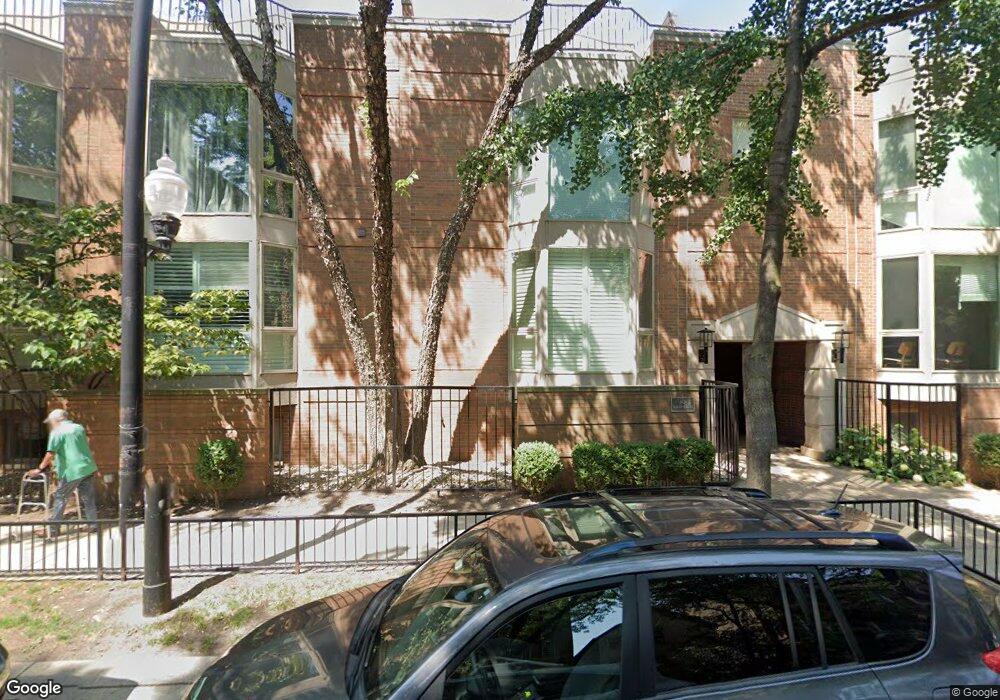
2024 N Racine Ave Unit H Chicago, IL 60614
West DePaul NeighborhoodEstimated Value: $974,279 - $1,082,000
3
Beds
4
Baths
48,385
Sq Ft
$21/Sq Ft
Est. Value
About This Home
This home is located at 2024 N Racine Ave Unit H, Chicago, IL 60614 and is currently estimated at $1,021,820, approximately $21 per square foot. 2024 N Racine Ave Unit H is a home located in Cook County with nearby schools including Mayer Elementary School, Lincoln Park High School, and St Josaphat School.
Ownership History
Date
Name
Owned For
Owner Type
Purchase Details
Closed on
Jun 17, 2009
Sold by
Meyer Jeffrey H and Gilbert Patricia G
Bought by
Pinkert Daniel N and Schwab Laura M
Current Estimated Value
Purchase Details
Closed on
Feb 7, 2001
Sold by
Meyer Jeffrey H and Meyer Patricia G
Bought by
Meyer Jeffrey H and Meyer Patricia G
Purchase Details
Closed on
Jul 28, 2000
Sold by
Roble Roger W and Roble Debra L
Bought by
Meyer Jeffrey H and Gilbert Patricia C
Purchase Details
Closed on
Feb 22, 1994
Sold by
Roble Roger W and Roble Debra Lynn
Bought by
Roble Roger William and Roble Debra Lynn
Create a Home Valuation Report for This Property
The Home Valuation Report is an in-depth analysis detailing your home's value as well as a comparison with similar homes in the area
Home Values in the Area
Average Home Value in this Area
Purchase History
| Date | Buyer | Sale Price | Title Company |
|---|---|---|---|
| Pinkert Daniel N | $625,000 | Cti | |
| Meyer Jeffrey H | -- | -- | |
| Meyer Jeffrey H | $487,500 | -- | |
| Roble Roger William | -- | -- |
Source: Public Records
Tax History Compared to Growth
Tax History
| Year | Tax Paid | Tax Assessment Tax Assessment Total Assessment is a certain percentage of the fair market value that is determined by local assessors to be the total taxable value of land and additions on the property. | Land | Improvement |
|---|---|---|---|---|
| 2024 | $14,743 | $84,220 | $20,313 | $63,907 |
| 2023 | $14,307 | $72,980 | $16,381 | $56,599 |
| 2022 | $14,307 | $72,980 | $16,381 | $56,599 |
| 2021 | $14,006 | $72,979 | $16,381 | $56,598 |
| 2020 | $13,078 | $61,810 | $14,415 | $47,395 |
| 2019 | $12,798 | $67,131 | $14,415 | $52,716 |
| 2018 | $12,582 | $67,131 | $14,415 | $52,716 |
| 2017 | $11,633 | $57,416 | $11,794 | $45,622 |
| 2016 | $11,000 | $57,416 | $11,794 | $45,622 |
| 2015 | $10,041 | $57,416 | $11,794 | $45,622 |
| 2014 | $8,784 | $49,914 | $8,845 | $41,069 |
| 2013 | $8,600 | $49,914 | $8,845 | $41,069 |
Source: Public Records
Map
Nearby Homes
- 2051 N Magnolia Ave
- 2014 N Seminary Ave Unit 2
- 2100 N Racine Ave Unit 4B
- 1242 W Dickens Ave
- 2103 N Clifton Ave
- 2127 N Racine Ave Unit 2
- 1929 N Maud Ave
- 2106 N Seminary Ave Unit 3
- 2026 N Kenmore Ave
- 2146 N Racine Ave Unit 1
- 2124 N Lakewood Ave
- 1872 N Clybourn Ave Unit 603
- 1312 W Webster Ave Unit 3W
- 2118 N Sheffield Ave Unit 2
- 2118 N Sheffield Ave Unit 1
- 2227 N Magnolia Ave
- 1962 N Bissell St
- 1013 W Webster Ave Unit 5
- 1728 N Clybourn Ave
- 1928 N Bissell St
- 2024 N Racine Ave Unit E
- 2024 N Racine Ave Unit N
- 2024 N Racine Ave Unit I
- 2024 N Racine Ave Unit C
- 2024 N Racine Ave Unit L
- 2024 N Racine Ave Unit S
- 2024 N Racine Ave Unit O
- 2024 N Racine Ave Unit R
- 2024 N Racine Ave Unit A
- 2024 N Racine Ave Unit K
- 2024 N Racine Ave Unit P
- 2024 N Racine Ave Unit M
- 2024 N Racine Ave Unit G
- 2024 N Racine Ave Unit J
- 2024 N Racine Ave Unit D
- 2024 N Racine Ave Unit F
- 2024 N Racine Ave
- 2000 N Racine Ave
- 1970 N Racine Ave Unit 2