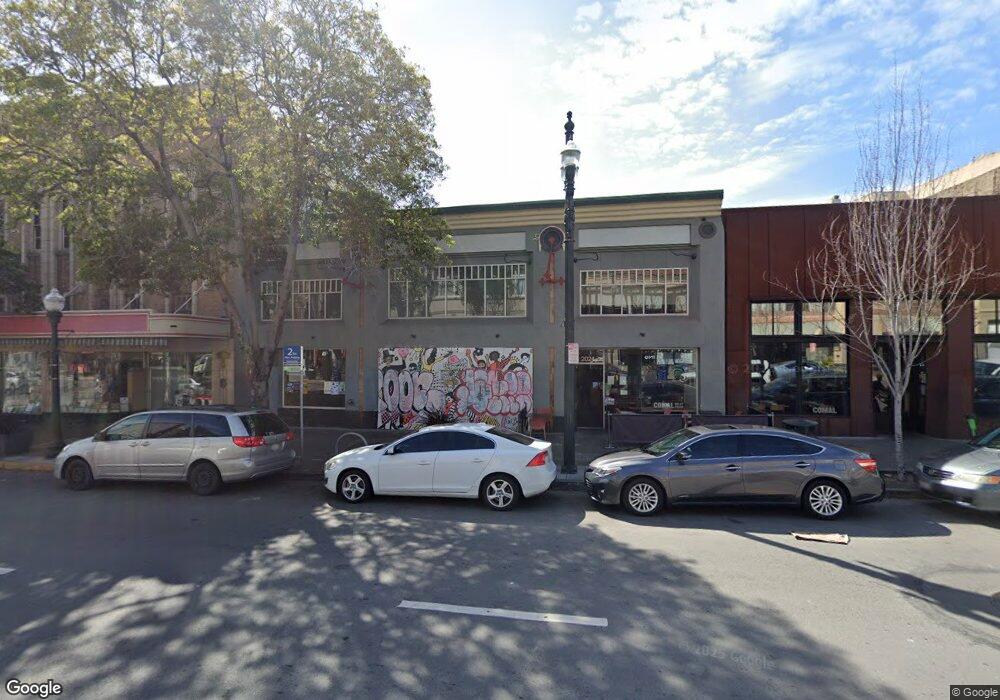
2024 Shattuck Ave Berkeley, CA 94704
Downtown Berkeley NeighborhoodEstimated Value: $3,648,034
Studio
3
Baths
10,749
Sq Ft
$339/Sq Ft
Est. Value
About This Home
This home is located at 2024 Shattuck Ave, Berkeley, CA 94704 and is currently priced at $3,648,034, approximately $339 per square foot. 2024 Shattuck Ave is a home located in Alameda County with nearby schools including Washington Elementary School, Berkeley Arts Magnet at Whittier School, and Oxford Elementary School.
Ownership History
Date
Name
Owned For
Owner Type
Purchase Details
Closed on
Feb 5, 2025
Sold by
John Gordon And Janis Mitchell Living Tr and Gordon Molly M
Bought by
Mid Kress Llc
Current Estimated Value
Purchase Details
Closed on
Jan 10, 2024
Sold by
John Gordon And Janis Mitchell Living Tr
Bought by
Riverside Trust and Gordon
Purchase Details
Closed on
Dec 23, 2020
Sold by
John Gordon And Janis Mitchell Living Tr and Gordon John K
Bought by
Riverside Trust and Gordon
Purchase Details
Closed on
Dec 17, 1998
Sold by
Chu Pei C
Bought by
Gordon John and Mitchell Janis L
Home Financials for this Owner
Home Financials are based on the most recent Mortgage that was taken out on this home.
Original Mortgage
$450,000
Interest Rate
6.91%
Mortgage Type
Commercial
Purchase Details
Closed on
Apr 22, 1998
Sold by
Shadrall Associates
Bought by
Marlo Acquisition Corp
Create a Home Valuation Report for This Property
The Home Valuation Report is an in-depth analysis detailing your home's value as well as a comparison with similar homes in the area
Home Values in the Area
Average Home Value in this Area
Purchase History
| Date | Buyer | Sale Price | Title Company |
|---|---|---|---|
| Mid Kress Llc | -- | None Listed On Document | |
| Riverside Trust | -- | None Listed On Document | |
| Riverside Trust | -- | None Listed On Document | |
| Gordon John | $740,000 | First American Title Guarant | |
| Marlo Acquisition Corp | $1,500,000 | First American Title |
Source: Public Records
Mortgage History
| Date | Status | Borrower | Loan Amount |
|---|---|---|---|
| Previous Owner | Gordon John | $450,000 | |
| Closed | Gordon John | $165,000 |
Source: Public Records
Tax History
| Year | Tax Paid | Tax Assessment Tax Assessment Total Assessment is a certain percentage of the fair market value that is determined by local assessors to be the total taxable value of land and additions on the property. | Land | Improvement |
|---|---|---|---|---|
| 2025 | $89,104 | $5,341,923 | $1,468,939 | $3,872,984 |
| 2024 | $89,104 | $5,088,492 | $1,399,479 | $3,689,013 |
| 2023 | $87,086 | $4,988,753 | $1,372,047 | $3,616,706 |
| 2022 | $85,430 | $4,890,937 | $1,345,145 | $3,545,792 |
| 2021 | $49,251 | $1,907,924 | $760,336 | $1,147,588 |
| 2020 | $45,932 | $1,888,366 | $752,540 | $1,135,826 |
| 2019 | $43,923 | $1,851,347 | $737,787 | $1,113,560 |
| 2018 | $43,052 | $1,815,054 | $723,324 | $1,091,730 |
| 2017 | $41,480 | $1,779,473 | $709,143 | $1,070,330 |
| 2016 | $41,371 | $1,744,590 | $695,241 | $1,049,349 |
| 2015 | $40,291 | $1,718,390 | $684,799 | $1,033,591 |
| 2014 | $39,601 | $1,684,733 | $671,385 | $1,013,348 |
Source: Public Records
Map
Nearby Homes
- 2015 Delaware St
- 2015 Delaware St Unit A
- 2218 -2222 Grant St
- 2201 Virginia St Unit 2
- 1610 Milvia St
- 1609 Bonita Ave Unit 3
- 1609 Bonita Ave Unit 5
- 2340 Virginia St
- 2451 Le Conte Ave
- 2118 California St
- 1901 Parker St Unit 3
- 2550 Dana St Unit 2F
- 1444 Walnut St
- 2415 Blake St
- 2533 Grant St
- 1512 Hearst Ave Unit 1512
- 2509 Dwight Way
- 1425 Martin Luther King jr Way
- 1813 Sacramento St
- 2535 Chilton Way
- 2008 Shattuck Ave
- 2072 Addison St
- 91 Shattuck Square
- 82 Shattuck Square
- 64 Shattuck Square
- 61 Shattuck Square
- 123 Berkeley Square
- 2114 Shattuck Ave
- 2067 University Ave
- 2057 University Ave
- 2059 University Ave
- 2018-2030 University Ave
- 2025 Kala Bagai Way Unit 201
- 2025 Kala Bagai Way
- 2037 Shattuck Ave
- 2023 Shattuck Ave
- 2017 Shattuck Ave
- 2055 Center St
- 2055 Center St
- 2055 Center St
Your Personal Tour Guide
Ask me questions while you tour the home.