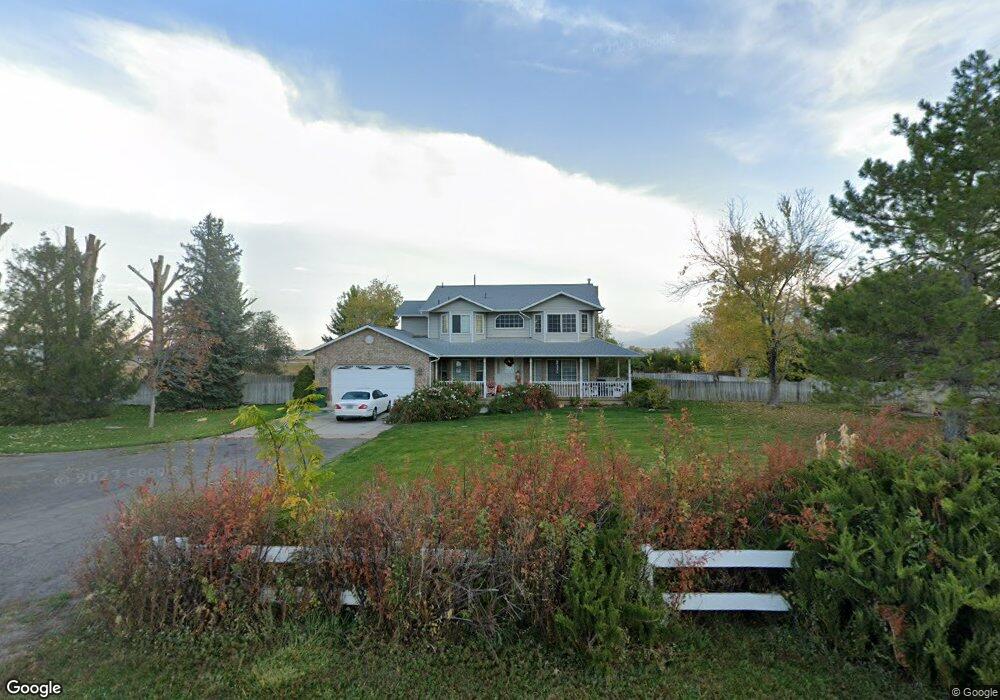
2024 W 10300 S Payson, UT 84651
Estimated Value: $922,795
3
Beds
3
Baths
2,175
Sq Ft
$424/Sq Ft
Est. Value
About This Home
This home is located at 2024 W 10300 S, Payson, UT 84651 and is currently priced at $922,795, approximately $424 per square foot. 2024 W 10300 S is a home with nearby schools including Barnett Elementary School, Salem Junior High School, and Valley View Middle School.
Ownership History
Date
Name
Owned For
Owner Type
Purchase Details
Closed on
Feb 14, 2025
Sold by
Pfleger Keith H and Pfleger Laura M
Bought by
Rural Housing Development Corporation
Current Estimated Value
Purchase Details
Closed on
Dec 17, 1997
Sold by
Pfleger Keith H
Bought by
Pfleger Keith H and Pfleger Laura M
Home Financials for this Owner
Home Financials are based on the most recent Mortgage that was taken out on this home.
Original Mortgage
$165,000
Interest Rate
7.23%
Create a Home Valuation Report for This Property
The Home Valuation Report is an in-depth analysis detailing your home's value as well as a comparison with similar homes in the area
Home Values in the Area
Average Home Value in this Area
Purchase History
| Date | Buyer | Sale Price | Title Company |
|---|---|---|---|
| Rural Housing Development Corporation | -- | Backman Title | |
| Pfleger Keith H | -- | First American Title | |
| Pfleger Keith H | -- | First American Title |
Source: Public Records
Mortgage History
| Date | Status | Borrower | Loan Amount |
|---|---|---|---|
| Previous Owner | Pfleger Keith H | $165,000 |
Source: Public Records
Tax History Compared to Growth
Tax History
| Year | Tax Paid | Tax Assessment Tax Assessment Total Assessment is a certain percentage of the fair market value that is determined by local assessors to be the total taxable value of land and additions on the property. | Land | Improvement |
|---|---|---|---|---|
| 2025 | $6,627 | $677,170 | $532,300 | $446,100 |
| 2024 | $6,846 | $662,415 | $0 | $0 |
| 2023 | $6,846 | $684,855 | $0 | $0 |
| 2022 | $6,400 | $886,400 | $540,600 | $345,800 |
| 2021 | $4,610 | $578,900 | $318,900 | $260,000 |
| 2020 | $4,362 | $535,100 | $275,100 | $260,000 |
| 2019 | $3,716 | $466,500 | $230,100 | $236,400 |
| 2018 | $3,431 | $420,300 | $186,100 | $234,200 |
| 2017 | $3,423 | $266,160 | $0 | $0 |
| 2016 | $3,162 | $238,390 | $0 | $0 |
| 2015 | $3,071 | $229,590 | $0 | $0 |
| 2014 | $3,070 | $229,590 | $0 | $0 |
Source: Public Records
Map
Nearby Homes
- 283 E 1250 N
- 283 E 1250 N Unit 64
- 1298 1670 N
- 248 N 1140 E
- 998 S 880 W
- 2363 E 370 St N Unit 7
- 2371 E 370 St N Unit 8
- 2351 E 370 St N Unit 6
- 585 S 1200 E
- 1235 W 940 S Unit 1B
- 753 N Emery Ln Unit 57
- 678 N Mountain View Dr
- 552 E Longview Dr Unit 29
- 350 E Meadow Lark Ln Unit 9
- 1000 S Goosenest Dr W
- 643 E Longview Dr Unit 8
- 942 W Wilcock Cove
- 4100 W 12400 S
- 761 N Birch Ln Unit 64
- 554 E Salem Hills Dr S Unit 2