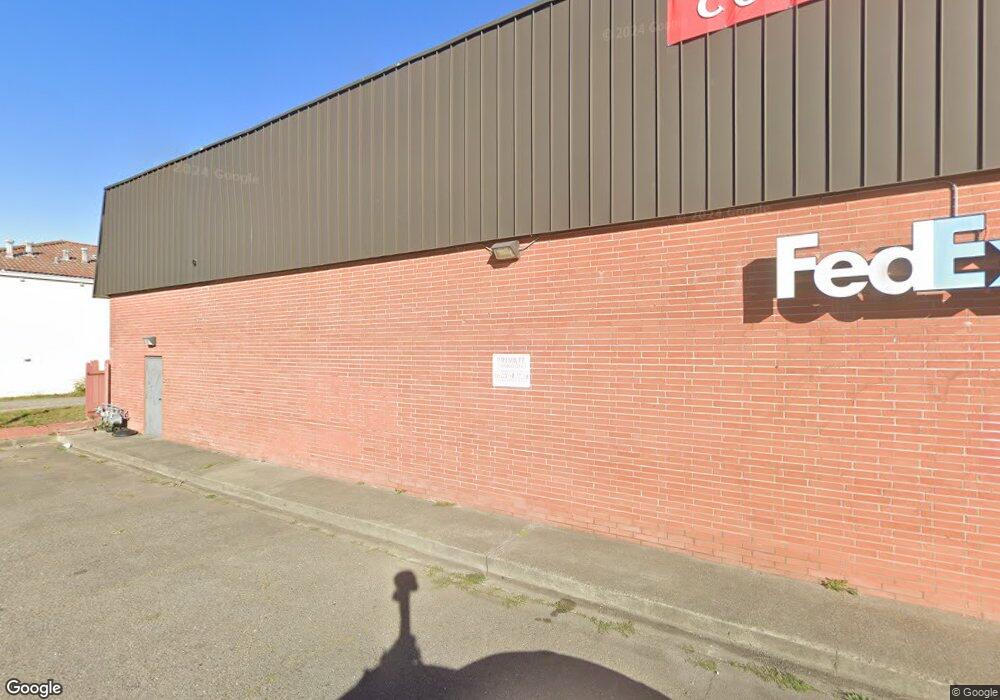
2025 5th St Eureka, CA 95501
City Center Neighborhood
Studio
3
Baths
8,625
Sq Ft
19,602
Sq Ft Lot
About This Home
This home is located at 2025 5th St, Eureka, CA 95501. 2025 5th St is a home located in Humboldt County with nearby schools including Lafayette Elementary School, Catherine L. Zane Middle School, and Eureka Senior High School.
Ownership History
Date
Name
Owned For
Owner Type
Purchase Details
Closed on
May 19, 2023
Sold by
Hamby & Johnson Properties Llc
Bought by
2025 Plaza Group Llc
Home Financials for this Owner
Home Financials are based on the most recent Mortgage that was taken out on this home.
Original Mortgage
$675,000
Outstanding Balance
$655,817
Interest Rate
6.27%
Mortgage Type
New Conventional
Purchase Details
Closed on
Jan 4, 2010
Sold by
Johnson Sean and Johnson Tracey
Bought by
Hamby & Johnson Properties Llc
Purchase Details
Closed on
Apr 22, 2004
Sold by
P & B Real Estate Investments Llc
Bought by
Johnson Sean and Johnson Tracey
Home Financials for this Owner
Home Financials are based on the most recent Mortgage that was taken out on this home.
Original Mortgage
$515,000
Interest Rate
5.35%
Mortgage Type
Commercial
Create a Home Valuation Report for This Property
The Home Valuation Report is an in-depth analysis detailing your home's value as well as a comparison with similar homes in the area
Home Values in the Area
Average Home Value in this Area
Purchase History
| Date | Buyer | Sale Price | Title Company |
|---|---|---|---|
| 2025 Plaza Group Llc | $900,000 | Fidelity National Title Compan | |
| Hamby & Johnson Properties Llc | -- | None Available | |
| Johnson Sean | $620,000 | First American Title Ins Co |
Source: Public Records
Mortgage History
| Date | Status | Borrower | Loan Amount |
|---|---|---|---|
| Open | 2025 Plaza Group Llc | $675,000 | |
| Previous Owner | Johnson Sean | $515,000 |
Source: Public Records
Tax History
| Year | Tax Paid | Tax Assessment Tax Assessment Total Assessment is a certain percentage of the fair market value that is determined by local assessors to be the total taxable value of land and additions on the property. | Land | Improvement |
|---|---|---|---|---|
| 2025 | $8,110 | $788,622 | $411,998 | $376,624 |
| 2024 | $8,110 | $773,160 | $403,920 | $369,240 |
| 2023 | $7,703 | $730,147 | $324,690 | $405,457 |
| 2022 | $7,996 | $715,831 | $318,324 | $397,507 |
| 2021 | $7,488 | $701,796 | $312,083 | $389,713 |
| 2020 | $7,432 | $694,600 | $308,883 | $385,717 |
| 2019 | $7,280 | $680,981 | $302,827 | $378,154 |
| 2018 | $7,170 | $667,630 | $296,890 | $370,740 |
| 2017 | $7,134 | $654,540 | $291,069 | $363,471 |
| 2016 | $7,136 | $641,707 | $285,362 | $356,345 |
| 2015 | $7,073 | $632,069 | $281,076 | $350,993 |
| 2014 | $6,612 | $619,689 | $275,571 | $344,118 |
Source: Public Records
Map
Nearby Homes
Your Personal Tour Guide
Ask me questions while you tour the home.