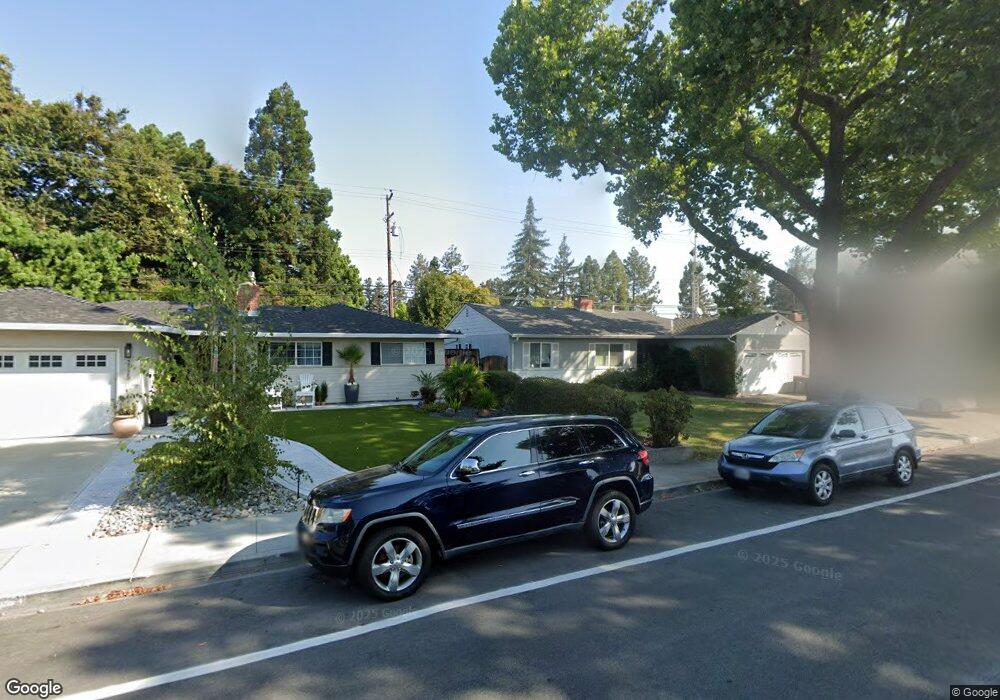
2025 Canary Island Ct Unit 3 Santa Clara, CA 95050
Estimated Value: $1,162,000 - $1,623,000
3
Beds
3
Baths
1,708
Sq Ft
$783/Sq Ft
Est. Value
About This Home
This home is located at 2025 Canary Island Ct Unit 3, Santa Clara, CA 95050 and is currently estimated at $1,336,795, approximately $782 per square foot. 2025 Canary Island Ct Unit 3 is a home located in Santa Clara County with nearby schools including Scott Lane Elementary School, Buchser Middle School, and Santa Clara High School.
Ownership History
Date
Name
Owned For
Owner Type
Purchase Details
Closed on
Mar 18, 2025
Sold by
Barrons Ross Ellis
Bought by
Ross Barrons Living Trust and Barrons
Current Estimated Value
Purchase Details
Closed on
Nov 7, 2007
Sold by
Rosenberg Jeffrey J and Rosenberg Sheri D
Bought by
Barrons Ross
Home Financials for this Owner
Home Financials are based on the most recent Mortgage that was taken out on this home.
Original Mortgage
$524,000
Interest Rate
6.35%
Mortgage Type
Purchase Money Mortgage
Purchase Details
Closed on
Dec 30, 1998
Sold by
Ciraulo Thomas J and Ciraulo Susan J
Bought by
Rosenberg Jeffrey J and Rosenberg Sheri D
Home Financials for this Owner
Home Financials are based on the most recent Mortgage that was taken out on this home.
Original Mortgage
$240,000
Interest Rate
6.73%
Create a Home Valuation Report for This Property
The Home Valuation Report is an in-depth analysis detailing your home's value as well as a comparison with similar homes in the area
Home Values in the Area
Average Home Value in this Area
Purchase History
| Date | Buyer | Sale Price | Title Company |
|---|---|---|---|
| Ross Barrons Living Trust | -- | None Listed On Document | |
| Barrons Ross | $655,000 | First American Title Company | |
| Rosenberg Jeffrey J | $320,000 | North American Title Co |
Source: Public Records
Mortgage History
| Date | Status | Borrower | Loan Amount |
|---|---|---|---|
| Previous Owner | Barrons Ross | $524,000 | |
| Previous Owner | Rosenberg Jeffrey J | $240,000 | |
| Closed | Rosenberg Jeffrey J | $35,000 |
Source: Public Records
Tax History Compared to Growth
Tax History
| Year | Tax Paid | Tax Assessment Tax Assessment Total Assessment is a certain percentage of the fair market value that is determined by local assessors to be the total taxable value of land and additions on the property. | Land | Improvement |
|---|---|---|---|---|
| 2025 | $9,815 | $860,340 | $430,170 | $430,170 |
| 2024 | $9,815 | $843,472 | $421,736 | $421,736 |
| 2023 | $9,815 | $826,934 | $413,467 | $413,467 |
| 2022 | $9,553 | $810,720 | $405,360 | $405,360 |
| 2021 | $9,516 | $794,824 | $397,412 | $397,412 |
| 2020 | $9,342 | $786,676 | $393,338 | $393,338 |
| 2019 | $9,329 | $771,252 | $385,626 | $385,626 |
| 2018 | $8,727 | $756,130 | $378,065 | $378,065 |
| 2017 | $8,684 | $741,304 | $370,652 | $370,652 |
| 2016 | $8,504 | $726,770 | $363,385 | $363,385 |
| 2015 | $8,471 | $715,854 | $357,927 | $357,927 |
| 2014 | $7,481 | $652,000 | $326,000 | $326,000 |
Source: Public Records
Map
Nearby Homes
- 2105 Rancho Mccormick Blvd
- 2171 Rancho Mccormick Blvd
- 2150 Menzel Place
- 2185 Royal Dr
- 2205 Royal Dr
- 2272 Cabrillo Ave
- 1855 Palm View Place Unit 123
- 2201 Monroe St Unit 102
- 2127 Monroe St
- 2125 Monroe St
- 1700 Civic Center Dr Unit 616
- 1700 Civic Center Dr Unit 214
- 1700 Civic Center Dr Unit 404
- 1700 Civic Center Dr Unit 707
- 1690 Civic Center Dr Unit 402
- 1938 Hillebrant Place
- 2044 Jackson St
- 1935 Jackson St
- 1850 El Camino Real Unit 210
- 1922 Main St
- 2015 Canary Island Ct
- 2035 Canary Island Ct
- 2005 Canary Island Ct
- 2045 Canary Island Ct Unit 1
- 2024 Acacia Ct
- 2014 Acacia Ct
- 2044 Acacia Ct
- 2004 Acacia Ct
- 2100 Rancho Mccormick Blvd Unit 6
- 2095 Cabrillo Ave
- 2110 Rancho Mccormick Blvd
- 2111 Cabrillo Ave
- 2085 Cabrillo Ave
- 2120 Rancho Mccormick Blvd
- 2125 Cabrillo Ave
- 2075 Cabrillo Ave
- 2101 Rancho Mccormick Blvd
- 2130 Rancho Mccormick Blvd
- 2111 Rancho Mccormick Blvd Unit 89
- 2003 Acacia Ct