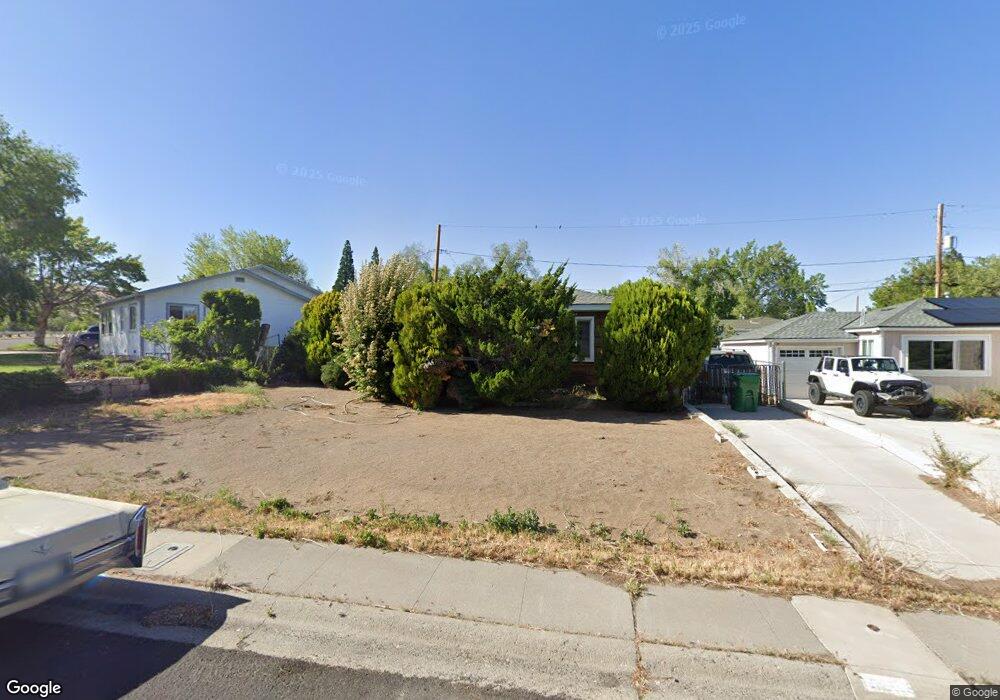
2025 Ellendale Rd Reno, NV 89503
Kings Row NeighborhoodEstimated Value: $417,000 - $496,000
2
Beds
2
Baths
993
Sq Ft
$445/Sq Ft
Est. Value
About This Home
This home is located at 2025 Ellendale Rd, Reno, NV 89503 and is currently estimated at $442,162, approximately $445 per square foot. 2025 Ellendale Rd is a home located in Washoe County with nearby schools including Peavine Elementary School, Archie Clayton Middle School, and Reno High School.
Ownership History
Date
Name
Owned For
Owner Type
Purchase Details
Closed on
Sep 8, 2014
Sold by
Ward Michael S
Bought by
Ward Michael S
Current Estimated Value
Purchase Details
Closed on
Aug 30, 2002
Sold by
Merriman Katherine B
Bought by
Merriman Katherine B and Katherine B Merriman Living Trust
Purchase Details
Closed on
Dec 31, 1996
Sold by
Tigner Barbara K
Bought by
Tigner Barbara K and Barbara K Tigner Living Trust
Create a Home Valuation Report for This Property
The Home Valuation Report is an in-depth analysis detailing your home's value as well as a comparison with similar homes in the area
Home Values in the Area
Average Home Value in this Area
Purchase History
| Date | Buyer | Sale Price | Title Company |
|---|---|---|---|
| Ward Michael S | -- | None Available | |
| Merriman Katherine B | -- | -- | |
| Merriman Katherine B | -- | -- | |
| Tigner Barbara K | -- | -- |
Source: Public Records
Tax History Compared to Growth
Tax History
| Year | Tax Paid | Tax Assessment Tax Assessment Total Assessment is a certain percentage of the fair market value that is determined by local assessors to be the total taxable value of land and additions on the property. | Land | Improvement |
|---|---|---|---|---|
| 2025 | $1,047 | $58,639 | $39,795 | $18,844 |
| 2024 | $1,047 | $56,101 | $37,485 | $18,616 |
| 2023 | $970 | $56,391 | $39,200 | $17,191 |
| 2022 | $899 | $45,398 | $31,500 | $13,899 |
| 2021 | $833 | $34,616 | $21,245 | $13,371 |
| 2020 | $781 | $33,243 | $19,985 | $13,258 |
| 2019 | $747 | $32,879 | $20,300 | $12,579 |
| 2018 | $704 | $26,314 | $14,455 | $11,859 |
| 2017 | $675 | $24,705 | $12,915 | $11,790 |
| 2016 | $659 | $23,132 | $11,340 | $11,792 |
| 2015 | $169 | $21,229 | $9,625 | $11,604 |
| 2014 | $640 | $19,576 | $8,575 | $11,001 |
| 2013 | -- | $16,811 | $6,125 | $10,686 |
Source: Public Records
Map
Nearby Homes
- 2120 Keystone Ave
- 1535 Van Ness Ave
- 1516 Coleman Dr
- 1835 Marlette Ave
- 1835 Van Ness Ave
- 1480 Grandview Ave
- 1540 King Edward Dr
- 2285 King Edward Dr
- 1375 Wesley Dr
- 1415 Kings Row
- 2815 Severn Dr
- 2920 Harding Cir
- 1670 Majestic Dr
- 1600 Majestic Dr
- 1510 Majestic Dr Unit one
- 840 Brookfield Dr
- 2600 Gellert Dr
- 1217 Keystone Ave
- 1275 Washington St
- 850 W 11th St
- 2005 Ellendale Rd
- 2075 Ellendale Rd
- 2020 Simpson Ave
- 2002 Simpson Ave
- 1985 Ellendale Rd
- 2085 Ellendale Rd
- 2030 Ellendale Rd
- 1980 Simpson Ave
- 2010 Ellendale Rd
- 1965 Ellendale Rd
- 2090 Bonneville Ave
- 1990 Ellendale Rd
- 1960 Simpson Ave
- 2080 Bonneville Ave
- 1970 Ellendale Rd
- 1945 Ellendale Rd
- 2055 Bonneville Ave
- 2025 Simpson Ave
- 2055 Simpson Ave
- 1940 Simpson Ave