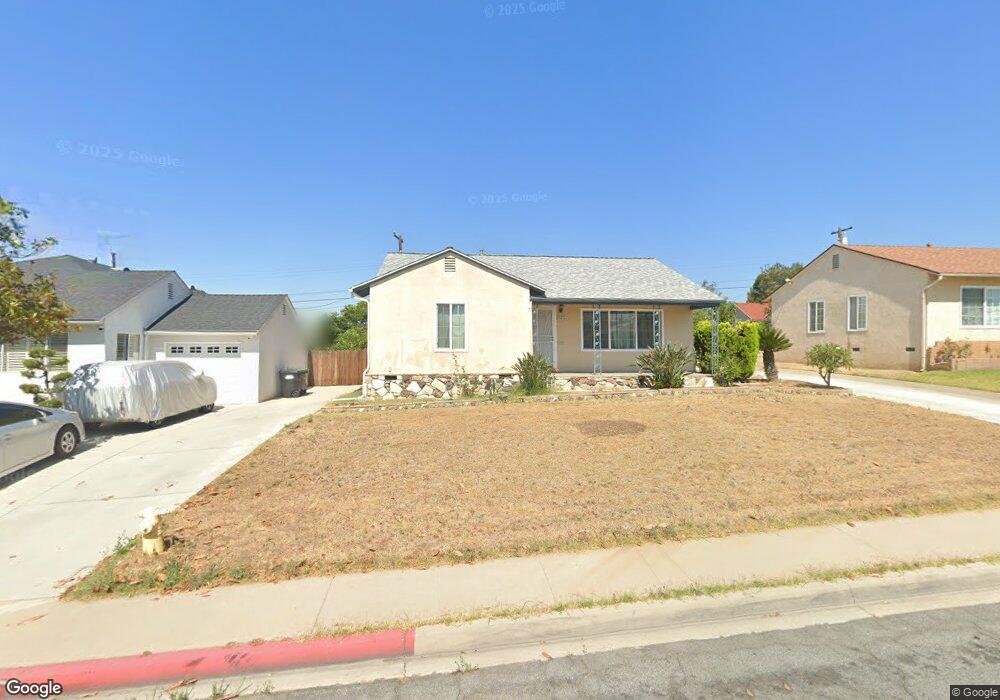
2025 Graylock Ave Monterey Park, CA 91754
Estimated Value: $749,425 - $1,006,000
3
Beds
1
Bath
1,035
Sq Ft
$824/Sq Ft
Est. Value
About This Home
This home is located at 2025 Graylock Ave, Monterey Park, CA 91754 and is currently estimated at $852,856, approximately $824 per square foot. 2025 Graylock Ave is a home located in Los Angeles County with nearby schools including Bella Vista Elementary School, Macy Intermediate School, and Schurr High School.
Ownership History
Date
Name
Owned For
Owner Type
Purchase Details
Closed on
Dec 22, 2015
Sold by
Manochi Anh
Bought by
Manochi Anh Vuong and The Anh Vuong Manochi Trust
Current Estimated Value
Purchase Details
Closed on
Sep 21, 2015
Sold by
Manochi Anh
Bought by
Manochi Anh
Purchase Details
Closed on
Dec 1, 1997
Sold by
Chan Siu Pong and Chan Yuk Po Lue
Bought by
Manochi James
Home Financials for this Owner
Home Financials are based on the most recent Mortgage that was taken out on this home.
Original Mortgage
$131,250
Interest Rate
7.25%
Purchase Details
Closed on
Jan 12, 1996
Sold by
Haupert Steve Alex and Lesko Katharina
Bought by
Chan Siu Pong and Chan Yuk Po Lue
Home Financials for this Owner
Home Financials are based on the most recent Mortgage that was taken out on this home.
Original Mortgage
$148,000
Interest Rate
7.25%
Purchase Details
Closed on
Apr 6, 1995
Sold by
Haupert Hilda
Bought by
Haupert Steve Alex
Create a Home Valuation Report for This Property
The Home Valuation Report is an in-depth analysis detailing your home's value as well as a comparison with similar homes in the area
Home Values in the Area
Average Home Value in this Area
Purchase History
| Date | Buyer | Sale Price | Title Company |
|---|---|---|---|
| Manochi Anh Vuong | -- | None Available | |
| Manochi Anh | -- | None Available | |
| Manochi James | $175,000 | Benefit Land Title Company | |
| Chan Siu Pong | $185,000 | Landsafe Title | |
| Haupert Steve Alex | -- | -- | |
| Haupert Albina | -- | -- |
Source: Public Records
Mortgage History
| Date | Status | Borrower | Loan Amount |
|---|---|---|---|
| Previous Owner | Manochi James | $131,250 | |
| Previous Owner | Chan Siu Pong | $148,000 |
Source: Public Records
Tax History Compared to Growth
Tax History
| Year | Tax Paid | Tax Assessment Tax Assessment Total Assessment is a certain percentage of the fair market value that is determined by local assessors to be the total taxable value of land and additions on the property. | Land | Improvement |
|---|---|---|---|---|
| 2025 | $3,799 | $279,399 | $172,114 | $107,285 |
| 2024 | $3,799 | $273,922 | $168,740 | $105,182 |
| 2023 | $3,802 | $268,552 | $165,432 | $103,120 |
| 2022 | $3,675 | $263,288 | $162,189 | $101,099 |
| 2021 | $3,550 | $258,126 | $159,009 | $99,117 |
| 2019 | $3,415 | $250,472 | $154,294 | $96,178 |
| 2018 | $3,435 | $245,562 | $151,269 | $94,293 |
| 2016 | $3,290 | $236,029 | $145,396 | $90,633 |
| 2015 | $3,093 | $232,485 | $143,213 | $89,272 |
| 2014 | $3,054 | $227,932 | $140,408 | $87,524 |
Source: Public Records
Map
Nearby Homes
- 2012 S Garfield Ave
- 105 E Floral Dr
- 500 A S Garfield Unit A
- 109 E Hammel St
- 1800 Fernbank Ave
- 1701 S Mcpherrin Ave
- 150 E Floral Dr
- 413 W Riggin St
- 1804 Wilcox Ave
- 498 W Riggin St
- 1100 S Grandridge Ave
- 352 E Riggin St
- 532 W Gleason St
- 1351 S Ynez Ave
- 1240 S Ynez Ave
- 833 Findlay Ave
- 1301 S Atlantic Blvd Unit 234C
- 1594 Trumbower Ave
- 3613 Via Campo
- 1027 De la Fuente St
- 2021 Graylock Ave
- 2029 Graylock Ave
- 2024 Brockwell Ave
- 2020 Brockwell Ave
- 2028 Brockwell Ave
- 2017 Graylock Ave
- 2033 Graylock Ave
- 2024 Graylock Ave
- 2016 Brockwell Ave
- 2032 Brockwell Ave
- 2020 Graylock Ave
- 2028 Graylock Ave
- 2013 Graylock Ave
- 2037 Graylock Ave
- 2016 Graylock Ave
- 2032 Graylock Ave
- 2012 Brockwell Ave
- 2036 Brockwell Ave
- 2036 Graylock Ave
- 2009 Graylock Ave