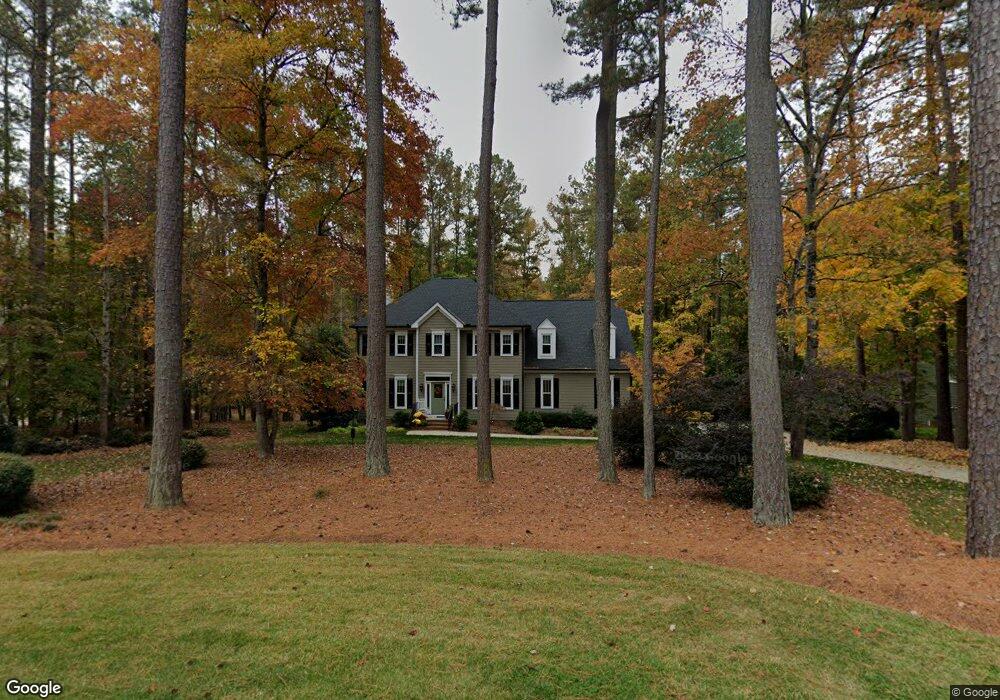
2025 Kinleys Way Raleigh, NC 27613
Estimated Value: $726,763 - $769,000
4
Beds
3
Baths
2,750
Sq Ft
$273/Sq Ft
Est. Value
About This Home
This home is located at 2025 Kinleys Way, Raleigh, NC 27613 and is currently estimated at $750,441, approximately $272 per square foot. 2025 Kinleys Way is a home located in Wake County with nearby schools including Pine Hollow Middle School, Leesville Road High School, and The Franciscan School.
Ownership History
Date
Name
Owned For
Owner Type
Purchase Details
Closed on
Jul 11, 2005
Sold by
Mclaughlin Thomas and Mclaughlin Jolyn
Bought by
Hardy Richard D and Hardy Katherine D
Current Estimated Value
Home Financials for this Owner
Home Financials are based on the most recent Mortgage that was taken out on this home.
Original Mortgage
$250,000
Interest Rate
5.57%
Mortgage Type
Fannie Mae Freddie Mac
Purchase Details
Closed on
Jul 18, 2003
Sold by
Wilson Dean F and Wilson Susan L
Bought by
Mclaughlin Thomas and Mclaughlin Jolyn
Home Financials for this Owner
Home Financials are based on the most recent Mortgage that was taken out on this home.
Original Mortgage
$160,000
Interest Rate
5.16%
Mortgage Type
Purchase Money Mortgage
Purchase Details
Closed on
Aug 10, 1998
Sold by
Bill Clark Homes Of Raleigh Llc
Bought by
Wilson Dean F and Wilson Susan L
Home Financials for this Owner
Home Financials are based on the most recent Mortgage that was taken out on this home.
Original Mortgage
$211,650
Interest Rate
6.97%
Create a Home Valuation Report for This Property
The Home Valuation Report is an in-depth analysis detailing your home's value as well as a comparison with similar homes in the area
Home Values in the Area
Average Home Value in this Area
Purchase History
| Date | Buyer | Sale Price | Title Company |
|---|---|---|---|
| Hardy Richard D | $330,000 | -- | |
| Mclaughlin Thomas | $298,500 | -- | |
| Wilson Dean F | $265,000 | -- |
Source: Public Records
Mortgage History
| Date | Status | Borrower | Loan Amount |
|---|---|---|---|
| Previous Owner | Hardy Richard D | $250,000 | |
| Previous Owner | Mclaughlin Thomas | $160,000 | |
| Previous Owner | Wilson Dean F | $211,650 |
Source: Public Records
Tax History Compared to Growth
Tax History
| Year | Tax Paid | Tax Assessment Tax Assessment Total Assessment is a certain percentage of the fair market value that is determined by local assessors to be the total taxable value of land and additions on the property. | Land | Improvement |
|---|---|---|---|---|
| 2025 | -- | $608,288 | $170,000 | $438,288 |
| 2024 | $3,719 | $595,600 | $170,000 | $425,600 |
| 2023 | $3,211 | $409,282 | $100,000 | $309,282 |
| 2022 | $2,976 | $409,282 | $100,000 | $309,282 |
| 2021 | $2,896 | $409,282 | $100,000 | $309,282 |
| 2020 | $2,848 | $409,282 | $100,000 | $309,282 |
| 2019 | $2,966 | $360,718 | $95,000 | $265,718 |
| 2018 | $2,727 | $360,718 | $95,000 | $265,718 |
| 2017 | $2,585 | $360,718 | $95,000 | $265,718 |
| 2016 | $2,532 | $360,718 | $95,000 | $265,718 |
| 2015 | $2,606 | $372,367 | $104,000 | $268,367 |
| 2014 | -- | $372,367 | $104,000 | $268,367 |
Source: Public Records
Map
Nearby Homes
- 12304 Whartons Way
- 2729 Sunnystone Way
- 2409 Loring Ct
- 11953 Eagle Cliff Ct
- 11913 Eagle Bluff Cir
- 5528 Hawthorne Park
- 2612 Scarlet Sage Ct
- 11804 Mountbatten Way
- 5308 Roan Mountain Place
- 8717 Little Deer Ln
- 5240 Indigo Moon Way
- 12316 Amoretto Way
- 11017 Peacock Moss St
- 5020 Red Cedar Rd
- 5316 Easthorpe Dr
- 11113 N Radner Way
- 1204 Meadow Moss Ct
- 5965 Dunbarton Way
- 5501 Stewartby Dr
- 12316 Inglehurst Dr
- 2029 Kinleys Way
- 2021 Kinleys Way
- 2613 Sunnystone Way
- 2024 Kinleys Way
- 2028 Kinleys Way
- 2017 Kinleys Way
- 2709 Sunnystone Way
- 2020 Kinleys Way
- 2616 Sunnystone Way
- 2605 Sunnystone Way
- 2612 Sunnystone Way
- 12745 Amoretto Way
- 2013 Kinleys Way
- 12749 Amoretto Way
- 2012 Kinleys Way
- 5817 N Hawthorne Way
- 2608 Sunnystone Way
- 12741 Amoretto Way
- 2713 Sunnystone Way
- 5801 N Hawthorne Way