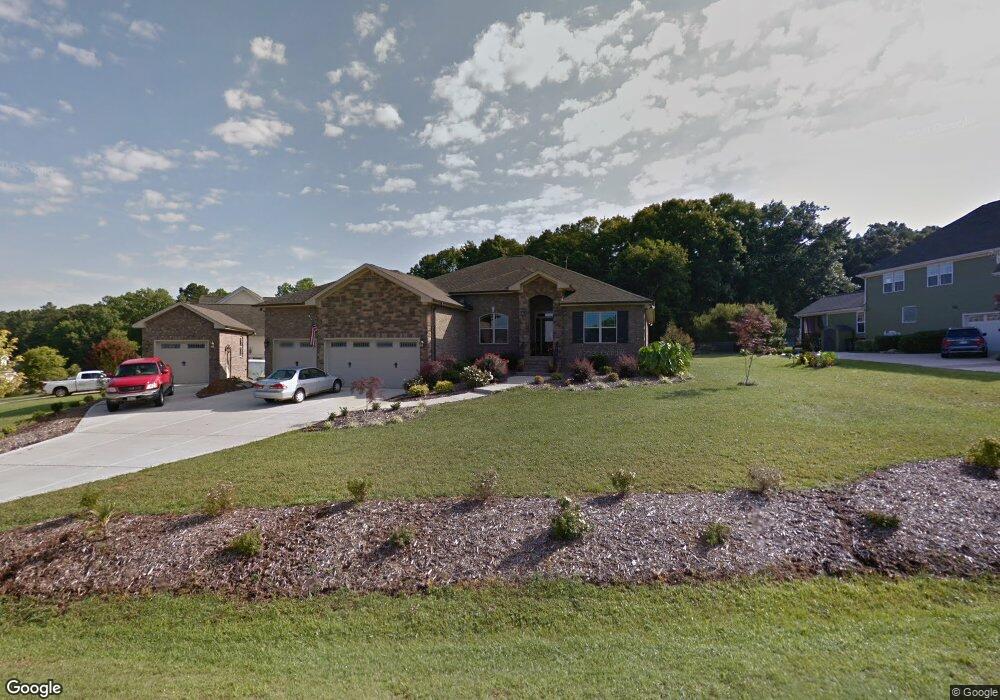
2025 Monthaven Dr Unit 17 Wake Forest, NC 27587
Falls Lake NeighborhoodEstimated Value: $681,736 - $747,000
--
Bed
1
Bath
2,630
Sq Ft
$272/Sq Ft
Est. Value
About This Home
This home is located at 2025 Monthaven Dr Unit 17, Wake Forest, NC 27587 and is currently estimated at $714,934, approximately $271 per square foot. 2025 Monthaven Dr Unit 17 is a home located in Wake County with nearby schools including North Forest Pines Elementary School, Wakefield Middle, and Wakefield High School.
Ownership History
Date
Name
Owned For
Owner Type
Purchase Details
Closed on
Jun 9, 2023
Sold by
Staton Mervin K and Staton Diana
Bought by
Farrell Michael and Farrell Nicole
Current Estimated Value
Home Financials for this Owner
Home Financials are based on the most recent Mortgage that was taken out on this home.
Original Mortgage
$528,800
Outstanding Balance
$510,682
Interest Rate
5%
Mortgage Type
New Conventional
Estimated Equity
$204,252
Purchase Details
Closed on
Sep 7, 2012
Sold by
Braun Steve M and Braun Jacqueline W
Bought by
Staton Mervin K and Staton Diana
Home Financials for this Owner
Home Financials are based on the most recent Mortgage that was taken out on this home.
Original Mortgage
$375,401
Interest Rate
3.53%
Mortgage Type
VA
Purchase Details
Closed on
Sep 6, 2011
Sold by
Branch Banking & Trust Company
Bought by
Braun Steve M
Purchase Details
Closed on
Jul 27, 2010
Sold by
Homestead Building Company
Bought by
Branch Banking & Trust Company
Create a Home Valuation Report for This Property
The Home Valuation Report is an in-depth analysis detailing your home's value as well as a comparison with similar homes in the area
Home Values in the Area
Average Home Value in this Area
Purchase History
| Date | Buyer | Sale Price | Title Company |
|---|---|---|---|
| Farrell Michael | $661,000 | None Listed On Document | |
| Staton Mervin K | $368,000 | None Available | |
| Braun Steve M | $55,000 | None Available | |
| Branch Banking & Trust Company | $142,500 | None Available |
Source: Public Records
Mortgage History
| Date | Status | Borrower | Loan Amount |
|---|---|---|---|
| Open | Farrell Michael | $528,800 | |
| Previous Owner | Staton Mervin K | $375,401 |
Source: Public Records
Tax History Compared to Growth
Tax History
| Year | Tax Paid | Tax Assessment Tax Assessment Total Assessment is a certain percentage of the fair market value that is determined by local assessors to be the total taxable value of land and additions on the property. | Land | Improvement |
|---|---|---|---|---|
| 2025 | $4,165 | $648,042 | $95,000 | $553,042 |
| 2024 | $4,044 | $648,042 | $95,000 | $553,042 |
| 2023 | $3,999 | $510,349 | $70,000 | $440,349 |
| 2022 | $3,706 | $510,349 | $70,000 | $440,349 |
| 2021 | $3,606 | $510,349 | $70,000 | $440,349 |
| 2020 | $3,547 | $510,349 | $70,000 | $440,349 |
| 2019 | $3,565 | $434,021 | $70,000 | $364,021 |
| 2018 | $3,277 | $434,021 | $70,000 | $364,021 |
| 2017 | $3,106 | $434,021 | $70,000 | $364,021 |
| 2016 | $3,043 | $434,021 | $70,000 | $364,021 |
| 2015 | $2,725 | $389,532 | $106,000 | $283,532 |
| 2014 | $2,583 | $389,532 | $106,000 | $283,532 |
Source: Public Records
Map
Nearby Homes
- 2005 Shingleback Dr
- 2053 Monthaven Dr
- 12708 Shephards Landing Dr
- 2305 Berteau Dr
- 8413 Portmarnock Ct
- 2209 Paddstowe Main Way
- 2312 Blue Crab Ct
- 2316 Blue Crab Ct
- 8600 Deep Elm Dr
- MARABELLE Plan at Bristol Run
- ELMSDALE Plan at Bristol Run
- DRESDEN Plan at Bristol Run
- BALLENTINE Plan at Bristol Run
- KENDALL Plan at Bristol Run
- SEBASTIAN Plan at Bristol Run
- CHAMPLAIN Plan at Bristol Run
- BRANFORD Plan at Bristol Run
- CHANLEY Plan at Bristol Run
- KAYLEEN Plan at Bristol Run
- BUCHANAN Plan at Bristol Run
- 2025 Monthaven Dr
- 2009 Monthaven Dr
- 2033 Monthaven Dr
- 2032 Monthaven Dr
- 2005 Monthaven Dr
- 2005 Monthaven Dr Unit 19
- 2037 Monthaven Dr
- 2020 Monthaven Dr
- 2024 Monthaven Dr
- 2012 Monthaven Dr
- 2016 Monthaven Dr
- 3609 Nolabee Ln
- 2028 Monthaven Dr
- 3616 Nolabee Ln
- 2036 Monthaven Dr
- 2041 Monthaven Dr
- 2008 Monthaven Dr
- 2008 Monthaven Dr Unit 23
- 2040 Monthaven Dr
- 2001 Monthaven Dr Unit 20