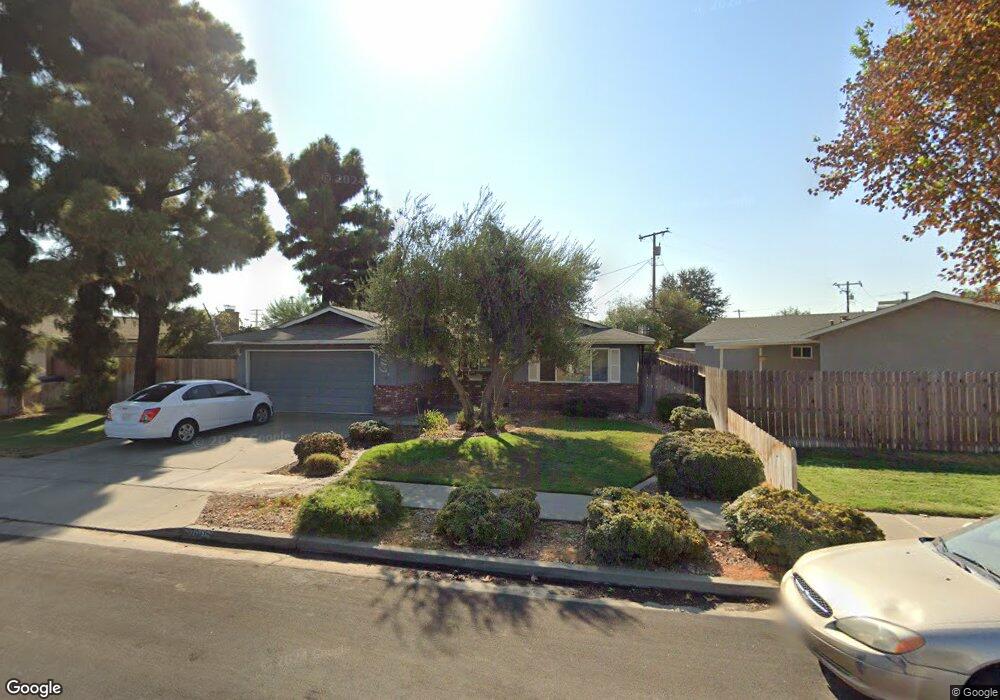
2025 N Waukena Way Hanford, CA 93230
Estimated Value: $290,432 - $332,000
3
Beds
2
Baths
1,156
Sq Ft
$268/Sq Ft
Est. Value
About This Home
This home is located at 2025 N Waukena Way, Hanford, CA 93230 and is currently estimated at $309,608, approximately $267 per square foot. 2025 N Waukena Way is a home located in Kings County with nearby schools including George Washington Elementary School, John F. Kennedy Junior High School, and Hanford High School.
Ownership History
Date
Name
Owned For
Owner Type
Purchase Details
Closed on
Jun 20, 2014
Sold by
Blue Kristy
Bought by
Blue Kristy and The Kristy Blue Revocable Trus
Current Estimated Value
Home Financials for this Owner
Home Financials are based on the most recent Mortgage that was taken out on this home.
Original Mortgage
$156,250
Interest Rate
4.17%
Mortgage Type
New Conventional
Purchase Details
Closed on
Feb 3, 2014
Sold by
Blue Kristy
Bought by
Blue Kristy and Kristy Blue Revocable Trust
Home Financials for this Owner
Home Financials are based on the most recent Mortgage that was taken out on this home.
Original Mortgage
$154,600
Interest Rate
4.46%
Mortgage Type
New Conventional
Purchase Details
Closed on
Dec 20, 2010
Sold by
Blue Kristy and Richwine Kristy Blue
Bought by
Blue Kristy and Kristy Blue Revocable Trust
Create a Home Valuation Report for This Property
The Home Valuation Report is an in-depth analysis detailing your home's value as well as a comparison with similar homes in the area
Home Values in the Area
Average Home Value in this Area
Purchase History
| Date | Buyer | Sale Price | Title Company |
|---|---|---|---|
| Blue Kristy | -- | None Available | |
| Blue Kristy | -- | None Available | |
| Blue Kristy | -- | None Available | |
| Blue Kristy | -- | None Available | |
| Blue Kristy | -- | None Available |
Source: Public Records
Mortgage History
| Date | Status | Borrower | Loan Amount |
|---|---|---|---|
| Closed | Blue Kristy | $156,250 | |
| Closed | Blue Kristy | $154,600 |
Source: Public Records
Tax History Compared to Growth
Tax History
| Year | Tax Paid | Tax Assessment Tax Assessment Total Assessment is a certain percentage of the fair market value that is determined by local assessors to be the total taxable value of land and additions on the property. | Land | Improvement |
|---|---|---|---|---|
| 2025 | $732 | $68,962 | $9,818 | $59,144 |
| 2023 | $732 | $66,287 | $9,438 | $56,849 |
| 2022 | $717 | $64,988 | $9,253 | $55,735 |
| 2021 | $701 | $63,715 | $9,072 | $54,643 |
| 2020 | $709 | $63,062 | $8,979 | $54,083 |
| 2019 | $697 | $61,826 | $8,803 | $53,023 |
| 2018 | $677 | $60,613 | $8,630 | $51,983 |
| 2017 | $667 | $59,425 | $8,461 | $50,964 |
| 2016 | $658 | $58,260 | $8,295 | $49,965 |
| 2015 | $654 | $57,384 | $8,170 | $49,214 |
| 2014 | $641 | $56,260 | $8,010 | $48,250 |
Source: Public Records
Map
Nearby Homes
- 2055 N Burl Dr
- 2015 N Burl Dr
- 1901 N Kensington Way
- 841 Moffat Dr
- 1807 Hardcastle Ave
- 852 E Grangeville Blvd Unit 98
- 852 E Grangeville Blvd Unit 6
- 860 E Grangeville Blvd
- 860 E Grangeville Blvd Unit 80
- 860 E Grangeville Blvd Unit 98
- 860 E Grangeville Blvd Unit 11
- 860 E Grangeville Blvd Unit 23
- 860 E Grangeville Blvd Unit 117
- 860 E Grangeville Blvd Unit 166
- 920 Moffat Dr
- 0 E Grangeville Blvd
- 325 E Amber Way
- 956 Clover Ln
- 405 E Magnolia Ave
- 2123 Cottonwood Ct
- 2005 N Waukena Way
- 2035 N Waukena Way
- 2000 Stratford Way
- 1928 Stratford Way
- 2001 N Waukena Way
- 2024 N Waukena Way
- 2034 N Waukena Way
- 1924 Stratford Way
- 2012 N Waukena Way
- 2044 N Waukena Way
- 2005 Stratford Way
- 2001 Stratford Way
- 1925 N Waukena Way
- 2008 N Waukena Way
- 2034 Stratford Way
- 1920 Stratford Way
- 2015 Stratford Way
- 1921 N Waukena Way
- 1933 Stratford Way
- 2045 N Burl Dr