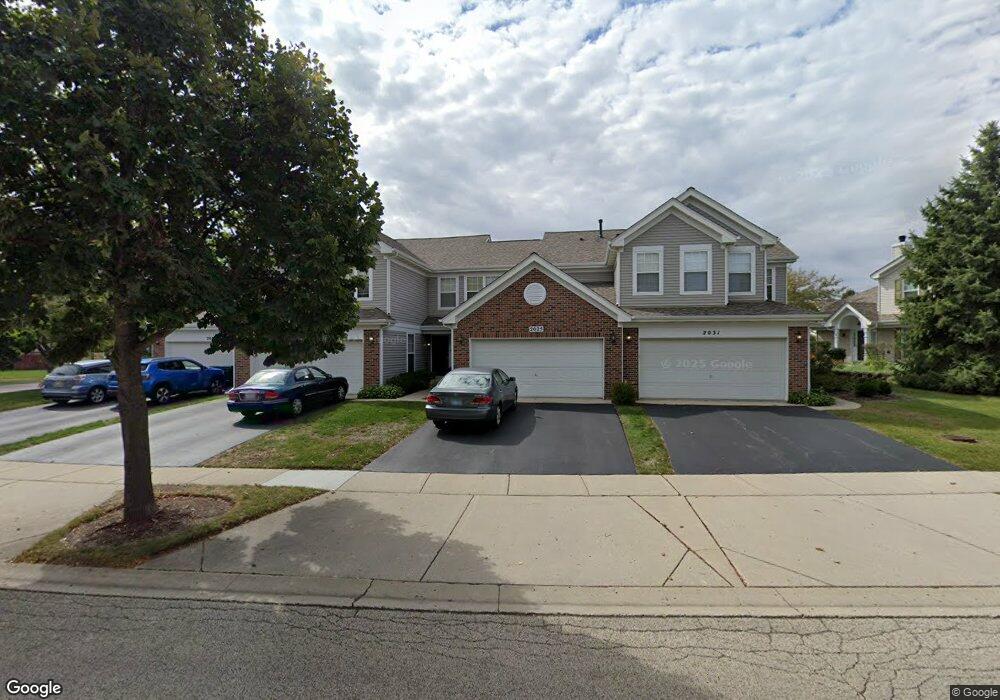
2025 Peach Tree Ln Unit 4133 Algonquin, IL 60102
Estimated Value: $278,846 - $296,000
2
Beds
--
Bath
1,332
Sq Ft
$214/Sq Ft
Est. Value
About This Home
This home is located at 2025 Peach Tree Ln Unit 4133, Algonquin, IL 60102 and is currently estimated at $285,212, approximately $214 per square foot. 2025 Peach Tree Ln Unit 4133 is a home located in Kane County with nearby schools including Westfield Community School, United Junior High School, and Harry D Jacobs High School.
Ownership History
Date
Name
Owned For
Owner Type
Purchase Details
Closed on
Sep 24, 1999
Sold by
Pilut Mark R and Pilut Donna L
Bought by
Piwowarczyk Hanna
Current Estimated Value
Home Financials for this Owner
Home Financials are based on the most recent Mortgage that was taken out on this home.
Original Mortgage
$76,000
Outstanding Balance
$23,051
Interest Rate
8.12%
Estimated Equity
$262,161
Purchase Details
Closed on
Jan 31, 1995
Sold by
Willoughby Farms Townhomes Ltd Prtnrshp
Bought by
Pilut Mark R and Pilut Donna L
Home Financials for this Owner
Home Financials are based on the most recent Mortgage that was taken out on this home.
Original Mortgage
$109,400
Interest Rate
9.24%
Mortgage Type
FHA
Create a Home Valuation Report for This Property
The Home Valuation Report is an in-depth analysis detailing your home's value as well as a comparison with similar homes in the area
Home Values in the Area
Average Home Value in this Area
Purchase History
| Date | Buyer | Sale Price | Title Company |
|---|---|---|---|
| Piwowarczyk Hanna | $126,000 | Chicago Title Insurance Co | |
| Pilut Mark R | $114,000 | Chicago Title Insurance Co |
Source: Public Records
Mortgage History
| Date | Status | Borrower | Loan Amount |
|---|---|---|---|
| Open | Piwowarczyk Hanna | $76,000 | |
| Previous Owner | Pilut Mark R | $109,400 |
Source: Public Records
Tax History Compared to Growth
Tax History
| Year | Tax Paid | Tax Assessment Tax Assessment Total Assessment is a certain percentage of the fair market value that is determined by local assessors to be the total taxable value of land and additions on the property. | Land | Improvement |
|---|---|---|---|---|
| 2024 | $4,971 | $73,386 | $8,371 | $65,015 |
| 2023 | $4,723 | $66,030 | $7,532 | $58,498 |
| 2022 | $4,528 | $60,178 | $7,532 | $52,646 |
| 2021 | $4,382 | $56,820 | $7,112 | $49,708 |
| 2020 | $4,292 | $55,542 | $6,952 | $48,590 |
| 2019 | $4,149 | $52,727 | $6,600 | $46,127 |
| 2018 | $3,727 | $46,425 | $6,469 | $39,956 |
| 2017 | $3,558 | $43,428 | $6,051 | $37,377 |
| 2016 | $3,640 | $42,049 | $5,859 | $36,190 |
| 2015 | -- | $39,401 | $5,490 | $33,911 |
| 2014 | -- | $38,313 | $5,338 | $32,975 |
| 2013 | -- | $45,634 | $5,501 | $40,133 |
Source: Public Records
Map
Nearby Homes
- 2043 Peach Tree Ln Unit 4122
- 1971 Peach Tree Ln
- 2101 Peach Tree Ln Unit 4094
- 000 County Line Rd
- 2161 Burnham Ct
- 1900 Waverly Ln
- 30 Arbordale Ct Unit 4284
- 2060 Dorchester Ave
- Adams Plan at Algonquin Meadows - Single Family
- Sequoia Plan at Algonquin Meadows - Single Family
- Bryce Plan at Algonquin Meadows - Single Family
- Rainier Plan at Algonquin Meadows - Single Family
- Santa Rosa Plan at Algonquin Meadows - Single Family
- Biscayne Plan at Algonquin Meadows - Single Family
- Marianne Plan at Algonquin Meadows - Traditional Townhomes
- Darcy Plan at Algonquin Meadows - Traditional Townhomes
- Charlotte Plan at Algonquin Meadows - Traditional Townhomes
- Amherst Plan at Algonquin Meadows - Urban Townhomes
- Chatham Plan at Algonquin Meadows - Urban Townhomes
- Chelsea Plan at Algonquin Meadows - Urban Townhomes
- 2023 Peach Tree Ln Unit 4132
- 2021 Peach Tree Ln Unit 4131
- 2031 Peach Tree Ln Unit 4134
- 8 Peach Tree Ct Unit 4141
- 28 Peach Tree Ct Unit 4162
- 4 Peach Tree Ct Unit 4143
- 2 Peach Tree Ct Unit 4144
- 6 Peach Tree Ct Unit 4142
- 2011 Peach Tree Ln
- 8 Cloverdale Ct Unit 4053
- 4 Cloverdale Ct Unit 4055
- 12 Cloverdale Ct Unit 12
- 6 Cloverdale Ct Unit 4054
- 10 Cloverdale Ct Unit 4052
- 10 Cloverdale Ct Unit 10
- 10 Cloverdale Ct Unit TBI
- 2041 Peach Tree Ln Unit 4121
- 2 Cloverdale Ct Unit 4056
- 2051 Peach Tree Ln Unit 4124
- 2053 Peach Tree Ln Unit 4125