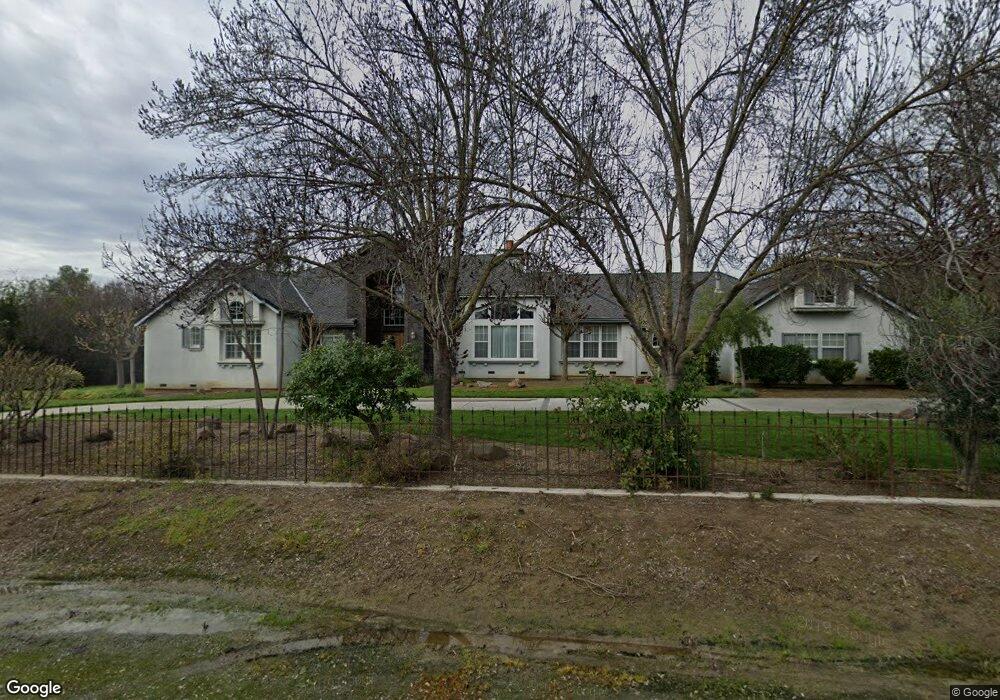
2025 Vincent Dr San Martin, CA 95046
Estimated Value: $2,121,955 - $3,205,000
4
Beds
4
Baths
3,673
Sq Ft
$682/Sq Ft
Est. Value
About This Home
This home is located at 2025 Vincent Dr, San Martin, CA 95046 and is currently estimated at $2,503,739, approximately $681 per square foot. 2025 Vincent Dr is a home located in Santa Clara County with nearby schools including San Martin/Gwinn Environmental Science Academy, Britton Middle School, and Live Oak High School.
Ownership History
Date
Name
Owned For
Owner Type
Purchase Details
Closed on
Jun 10, 2009
Sold by
Haefele Joseph E and Haefele June L
Bought by
Haefele June L and Haefele Joseph E
Current Estimated Value
Home Financials for this Owner
Home Financials are based on the most recent Mortgage that was taken out on this home.
Original Mortgage
$510,000
Outstanding Balance
$323,093
Interest Rate
4.82%
Mortgage Type
Stand Alone Refi Refinance Of Original Loan
Estimated Equity
$2,180,646
Purchase Details
Closed on
Feb 14, 1994
Sold by
Cordy John R
Bought by
Haefele Joseph E and Haefele June L
Home Financials for this Owner
Home Financials are based on the most recent Mortgage that was taken out on this home.
Original Mortgage
$500,000
Interest Rate
7.24%
Mortgage Type
Purchase Money Mortgage
Create a Home Valuation Report for This Property
The Home Valuation Report is an in-depth analysis detailing your home's value as well as a comparison with similar homes in the area
Home Values in the Area
Average Home Value in this Area
Purchase History
| Date | Buyer | Sale Price | Title Company |
|---|---|---|---|
| Haefele June L | -- | Ticor Title Company Of Ca | |
| Haefele Joseph E | $650,000 | Old Republic Title Company |
Source: Public Records
Mortgage History
| Date | Status | Borrower | Loan Amount |
|---|---|---|---|
| Open | Haefele June L | $510,000 | |
| Closed | Haefele Joseph E | $500,000 |
Source: Public Records
Tax History Compared to Growth
Tax History
| Year | Tax Paid | Tax Assessment Tax Assessment Total Assessment is a certain percentage of the fair market value that is determined by local assessors to be the total taxable value of land and additions on the property. | Land | Improvement |
|---|---|---|---|---|
| 2025 | $12,528 | $1,120,858 | $297,432 | $823,426 |
| 2024 | $12,528 | $1,098,881 | $291,600 | $807,281 |
| 2023 | $12,366 | $1,077,335 | $285,883 | $791,452 |
| 2022 | $12,157 | $1,056,212 | $280,278 | $775,934 |
| 2021 | $11,852 | $1,035,503 | $274,783 | $760,720 |
| 2020 | $11,564 | $1,024,886 | $271,966 | $752,920 |
| 2019 | $11,891 | $1,004,791 | $266,634 | $738,157 |
| 2018 | $11,927 | $985,090 | $261,406 | $723,684 |
| 2017 | $11,814 | $965,776 | $256,281 | $709,495 |
| 2016 | $11,066 | $946,840 | $251,256 | $695,584 |
| 2015 | $10,947 | $932,618 | $247,482 | $685,136 |
| 2014 | $11,112 | $914,351 | $242,635 | $671,716 |
Source: Public Records
Map
Nearby Homes
- 2115 Gwinn Ave
- 12467 Creekview Ct
- 12550 Center Ave
- 1925 Church Ave
- 13035 Center Ave
- 11840 Foothill Ave
- 905 E San Martin Ave
- 13755 Columbet Ave
- 13640 Sycamore Ave
- 13705 Sycamore Ave
- 10980 New Ave
- 13690 Murphy Ave #E
- 2525 Bridle Path Dr
- 0 W San Martin Ave
- 0 Llagas Ave Unit ML82019140
- 145 Masten Ave
- 30 Chester Ave
- 310 Lena Ave
- 12320 Highland Estates Ln
- 2055 Rucker Ave
- 2035 Vincent Dr
- 2010 Vincent Dr
- 2000 Vincent Dr
- 2030 Vincent Dr
- 2039 Vincent Dr
- 2020 Vincent Dr
- 1975 Gwinn Ave
- 1750 Renaissance Ct
- 1995 Vincent Dr
- 1965 Gwinn Ave
- 2045 Vincent Dr
- 2090 Vincent Dr
- 2125 Gwinn Ave
- 1747 Renaissance Ct
- 0 Renaissance Ct Unit ML81578110
- 2095 Vincent Dr
- 2175 Gwinn Ave
- 2030 Gwinn Ave
- 12755 New Ave
- 1990 Pinecrest Dr