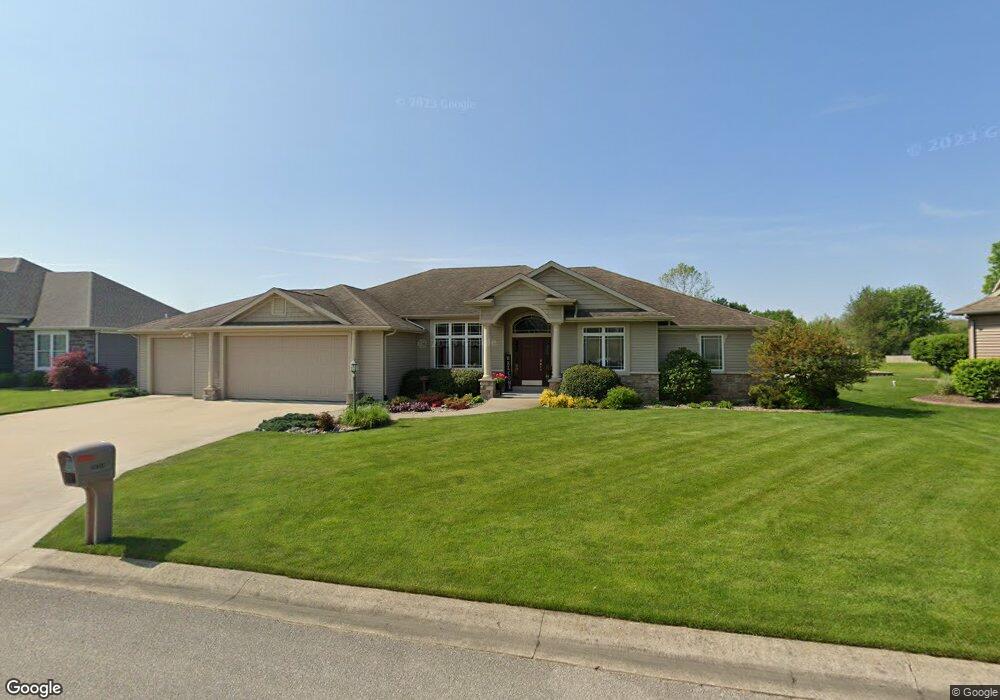
20258 Deer Path Ct Goshen, IN 46528
Estimated Value: $433,316 - $516,000
3
Beds
2
Baths
4,356
Sq Ft
$106/Sq Ft
Est. Value
About This Home
This home is located at 20258 Deer Path Ct, Goshen, IN 46528 and is currently estimated at $463,079, approximately $106 per square foot. 20258 Deer Path Ct is a home located in Elkhart County with nearby schools including Heritage Intermediate School, Orchard View School, and Northridge Middle School.
Ownership History
Date
Name
Owned For
Owner Type
Purchase Details
Closed on
Jun 15, 2009
Sold by
First Federal Savings Bank
Bought by
Holmes Stephen G and Holmes Cheryl D
Current Estimated Value
Purchase Details
Closed on
May 1, 2009
Sold by
Koets Beverly J
Bought by
First Federal Savings Bank
Purchase Details
Closed on
Sep 20, 2007
Sold by
Square 1 Builders Inc
Bought by
Koets Thomas K and Koets Beverly J
Home Financials for this Owner
Home Financials are based on the most recent Mortgage that was taken out on this home.
Original Mortgage
$277,314
Interest Rate
6.63%
Mortgage Type
Purchase Money Mortgage
Purchase Details
Closed on
Aug 21, 2007
Sold by
Pheasant Ridge Development Co Inc
Bought by
Square 1 Builders Inc
Home Financials for this Owner
Home Financials are based on the most recent Mortgage that was taken out on this home.
Original Mortgage
$277,314
Interest Rate
6.63%
Mortgage Type
Purchase Money Mortgage
Create a Home Valuation Report for This Property
The Home Valuation Report is an in-depth analysis detailing your home's value as well as a comparison with similar homes in the area
Home Values in the Area
Average Home Value in this Area
Purchase History
| Date | Buyer | Sale Price | Title Company |
|---|---|---|---|
| Holmes Stephen G | -- | Metropolitan Title | |
| First Federal Savings Bank | -- | None Available | |
| Koets Thomas K | -- | None Available | |
| Square 1 Builders Inc | -- | None Available |
Source: Public Records
Mortgage History
| Date | Status | Borrower | Loan Amount |
|---|---|---|---|
| Previous Owner | Koets Thomas K | $277,314 |
Source: Public Records
Tax History Compared to Growth
Tax History
| Year | Tax Paid | Tax Assessment Tax Assessment Total Assessment is a certain percentage of the fair market value that is determined by local assessors to be the total taxable value of land and additions on the property. | Land | Improvement |
|---|---|---|---|---|
| 2024 | $3,147 | $378,400 | $45,800 | $332,600 |
| 2022 | $3,147 | $327,200 | $45,800 | $281,400 |
| 2021 | $2,955 | $299,200 | $45,800 | $253,400 |
| 2020 | $2,847 | $289,300 | $45,800 | $243,500 |
| 2019 | $2,752 | $286,400 | $45,800 | $240,600 |
| 2018 | $2,658 | $276,000 | $45,800 | $230,200 |
| 2017 | $2,583 | $263,700 | $45,800 | $217,900 |
| 2016 | $2,384 | $260,400 | $45,800 | $214,600 |
| 2014 | $2,270 | $240,500 | $45,800 | $194,700 |
| 2013 | $2,405 | $240,500 | $45,800 | $194,700 |
Source: Public Records
Map
Nearby Homes
- 20208 Deer Path Ct
- 20237 Eagle Hill Ln
- 20467 Fieldstone Crossing Dr
- 57467 County Road 19
- 57384 Emerald Chase Ln
- 19855 Brookmist Cir
- 57445 Emerald Chase Ln
- 57374 Jade Cir
- 57143 Garnet Ln
- 20043 Turquoise Ln
- 20190 Us Highway 20
- 56838 County Road 19
- 20630 County Road 20
- 19861 County Road 16
- Lot 4B Alpha Dr
- 00 County Road 18
- 18961 Wilderness Dr
- 00000 Barbarrah Dr
- 19353 Dorchester Ct
- 56237 Whispering Hill Dr
- 20230 Deer Path Ct
- 20235 Deer Path Ct
- 20263 Deer Path Ct
- 20291 Deer Path Ct
- 20316 Deer Path Ct
- 20207 Deer Path Ct
- 20176 Deer Path Ct
- 20334 Deer Path Ct
- 20319 Deer Path Ct
- 20210 Fall Creek Dr
- 20237 Blue Heron Dr
- 20255 Blue Heron Dr
- 20179 Deer Path Ct
- 20190 Fall Creek Dr
- 57776 Hillside Dr
- 20148 Deer Path Ct
- 20163 Stone Creek Dr
- 20279 Blue Heron Dr
- 20211 Blue Heron Dr
- 57752 Hillside Dr